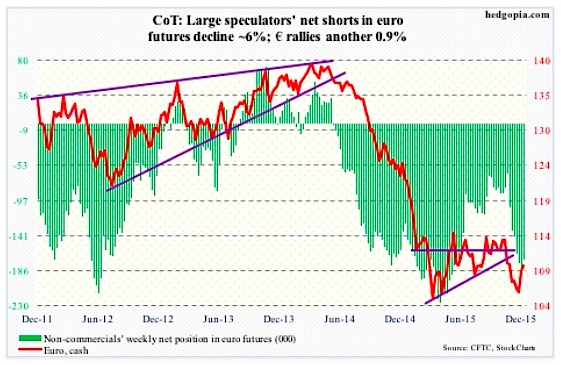
Euro: The currency continued to add this week to last week’s 2.9-percent gains. The Euro has now rallied four-plus percent in seven sessions, and is overbought on a daily chart.
Twice this week, the Euro was repelled by its 200-day moving average. The 50-day moving average is right below. Both averages are still pointing down.
Depending on what the Federal Reserve pulls out of its hat this week, there is room for unwinding of the near-term overbought conditions the Euro is in.
Non-commercials slightly cut back, but continue to remain heavily net short the Euro per recent COT report data.
COT Report Data: Currently net short 172.3k, down 10.5k.
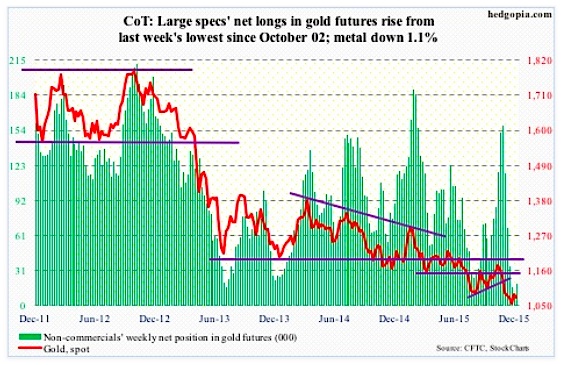
Gold: Near term, Gold’s fate probably lies in what comes out of the FOMC next week.
If the Federal Reserve signals this hike is the last one for some time to come, the gold prices likely have room to rally. It is oversold, particularly on a weekly basis.
The odds are very low, but if the Federal Reserve disappoints as it did in September – by not raising – then there is room for short squeeze.
In November, short interest on the iShares Gold ETF (GLD), rose from 8.7 million shares to 13.1 million shares.
Plus, last week, non-commercials had the least net longs since October 2002. This week, COT report data shows that they added some.
COT Report Data: Currently net long 19.6k, up 9.9k.
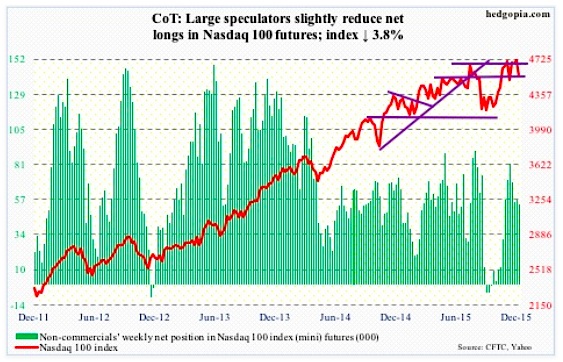
Nasdaq 100 Index (mini): With the 3.8-percent drop this week, the Nasdaq 100 has now slightly breached 4560 support, which also approximates the 50-day moving average (4572). The 200-day moving average lies at 4461, and likely gets tested.
In the past month, non-commercials have cut back net longs by 34 percent.
COT Report Data: Currently net long 54k, down 2.8k.
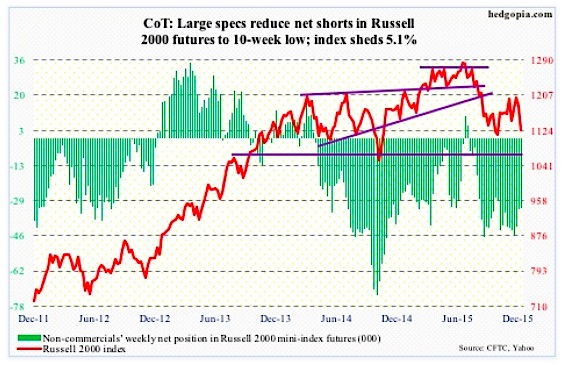
Russell 2000 mini-Index: Along with small-caps stocks, high-yield bonds help investors/traders take a pulse of risk-on/risk-off.
In this respect, high-yield bond ETFs are getting sold off hard. Trading volume has picked up. One wonders if institutional money is taking advantage of the drop in the SPDR High Yield Bond ETF (JNK), and the iShares High Yield Bond ETF (HYG). Or, maybe not.
The bigger question is, is the high-yield malaise just related to energy or spreading to other sectors/industries?
Fitch Ratings predicts that the energy sector’s default rate will surge to 11 percent in 2016, and that the U.S. high-yield default rate will rise to 4.5 percent. Taking out energy and metals/mining, however, the high-yield default rate drops to a manageable 1.5 percent.
The probable root cause? The business cycle is maturing and corporate costs are rising. This is reflected in how small-caps stocks are trading, down a whopping 5.1 percent in the week.
For weeks/months, it has paid to listen to non-commercials, who have doggedly remained bearish on the Russell 2000.
COT Report Data: Currently net short 32.5k, down 607.
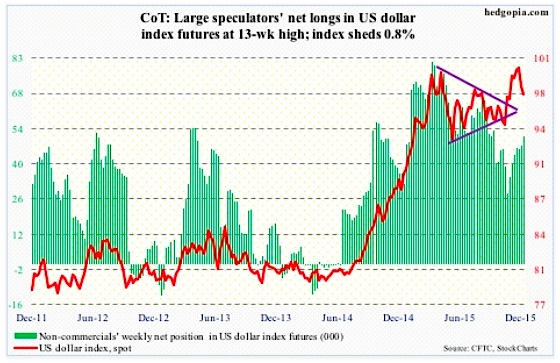
US Dollar Index: After the IMF’s SDR decision last week, China has guided its yuan fix lower. November exports fell 6.8 percent, down for five straight months.
While China may not want to lose control of the situation, further depreciation can risk competitive devaluation by other central banks.
The ECB just last week lowered its discount rate, and extended its existing QE program. Japan is in the midst of its QE.
Amidst all this comes a rather hawkish message from the Fed.
The US Dollar index, having rallied into this, and overbought both near- and medium-term, has come under pressure. The massive December 3rd sell-off has potential to be an important inflection point for the US Dollar index.
COT Report Data: Currently net long 51k, up 3.7k.
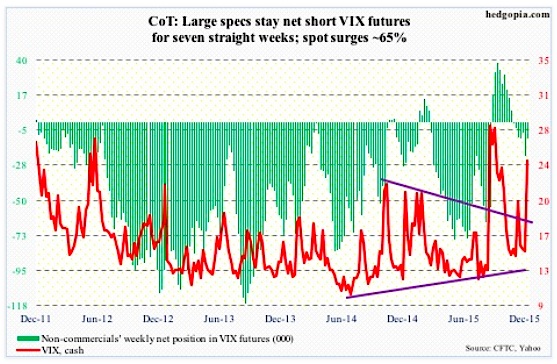
VIX Volatility Index: Having surged 9.58 points for the week, spot Volatility Index (VIX) took care of multiple resistance levels – 50- and 200-day moving averages as well horizontal resistance at 16 and 21-22.
The VIX is beginning to look overbought on a daily basis, but the thing to watch for is a spike-reversal, in which volatility spikes but only to reverse hard. That is the time to go long stocks.
As well, the VIX to VXV ratio spiked to unity on Friday. Several times in the past, the ratio has peaked around this level, which tends to help stocks. That said, it has yet to peak and head lower.
COT Report Data: Currently net short 10.2k, down 11.6k.
Thanks for reading.
Twitter: @hedgopia
Read more from Paban on his blog.
The author does not have a position in any of the mentioned securities at the time of publication. Any opinions expressed herein are solely those of the author, and do not in any way represent the views or opinions of any other person or entity.


