The following are charts and data showing non-commercial futures trading positions as of October 24, 2017.
This data was released with the October 27 Commitment of Traders Report (COT). Note that these charts also appeared on my blog.
The charts below looks at non-commercial futures trading positions for the S&P 500 (INDEXSP:.INX), Russell 2000 (INDEXRUSSELL:RUT) and VIX Volatility Index (INDEXCBOE:VIX).
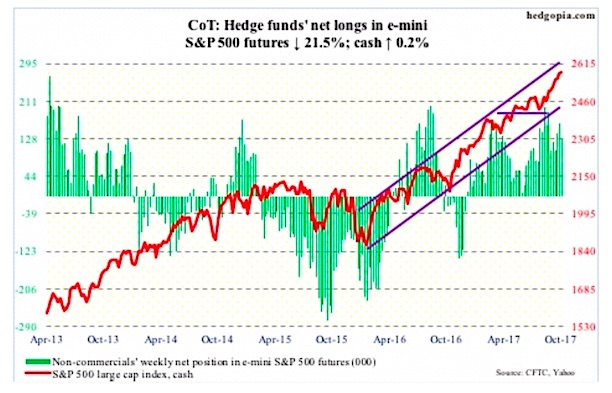
E-mini S&P 500 Futures: Currently net long 127.1k, down 34.8k.
Yet another week in which three S&P 500-focused ETF’s – The SPDR S&P 500 ETF (NYSEARCA:SPY), The Vanguard S&P 500 ETF (NYSEARCA:VOO) and iShares core S&P 500 ETF (NYSEARCA:IVV) – saw decent inflows. In the week through Wednesday, they together attracted $5.1 billion, following $6.1 billion in the prior week (courtesy of ETF.com).
In the same week, $4.7 billion moved into U.S.-based equity funds, following inflows of $8.3 billion in the prior two (courtesy of Lipper).
Despite these flows, amidst persistent complacent investor sentiment, the S&P 500 (cash) only eked out a 0.2-percent rise for the week, aided by Friday’s 0.8-percent rally to a new all-time high of 2582.98.
The weekly chart produced a dragonfly doji. The cash is at its highs, not at the end of a downtrend. So at best this indicates indecision among traders.
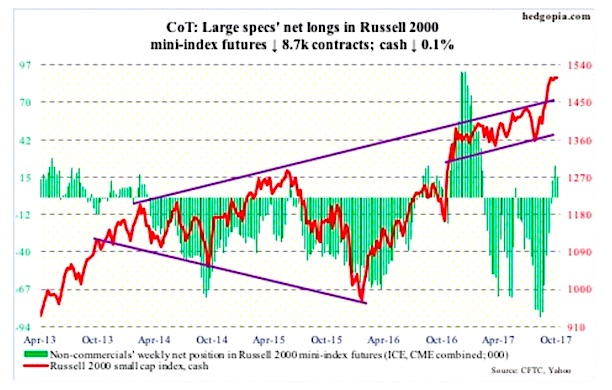
Russell 2000 mini-index Futures: Currently net long 15k, down 8.7k.
In the week to Wednesday, iShares Russell 2000 ETF (NYSEARCA:IWM) attracted $629 million, and iShares core S&P small-cap ETF (IJR) $59 million (courtesy of ETF.com).
The Russell 2000 (cash), however, continues to show signs of fatigue. The index (1508.32) peaked at a new all-time high of 1514.94 on the 5th this month, and has essentially been flat for the past four weeks.
Daily Bollinger bands have tightened quite a bit. A sharp move is likely in the making.
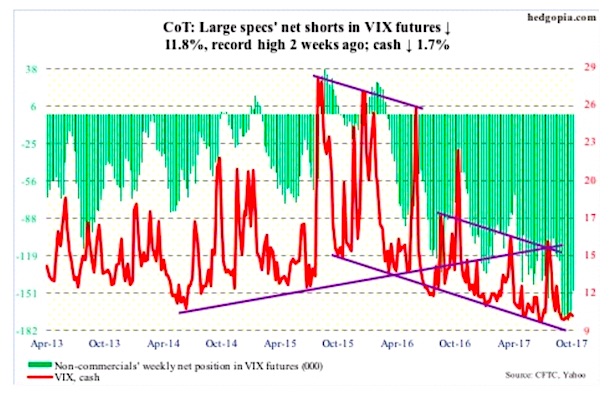
VIX Volatility Index Futures: Currently net short 148.7k, down 19.8k.
Same old, same old. Wednesday’s 18.3-percent intraday rally on the VIX Volatility Index ( ) was slammed hard, in the end closing up only 0.6 percent. Then came Friday’s 13.3-percent drop to 9.80 – first sub-10 close this week and sixth straight weekly sub-10 close – losing 10-, 20-, 50- and 200-day at one go.
In ideal circumstances, there is plenty of room for volatility to rise on the weekly chart. For volatility bulls, the current environment has been anything but ideal.
The CBOE equity put-to-call ratio was .55 Friday.
Thanks for reading.
Twitter: @hedgopia
Author may hold a position in mentioned securities at the time of publication. Any opinions expressed herein are solely those of the author, and do not in any way represent the views or opinions of any other person or entity.


