The broader commodities market is enjoying a multi-month rally that has seen momentum carry over into early 2021.
One area of commodities that’s seen a big lift the metals space. We hear a lot about gold and silver, but how about copper? One look at today’s chart and it’s clear that Doc Copper is on fire.
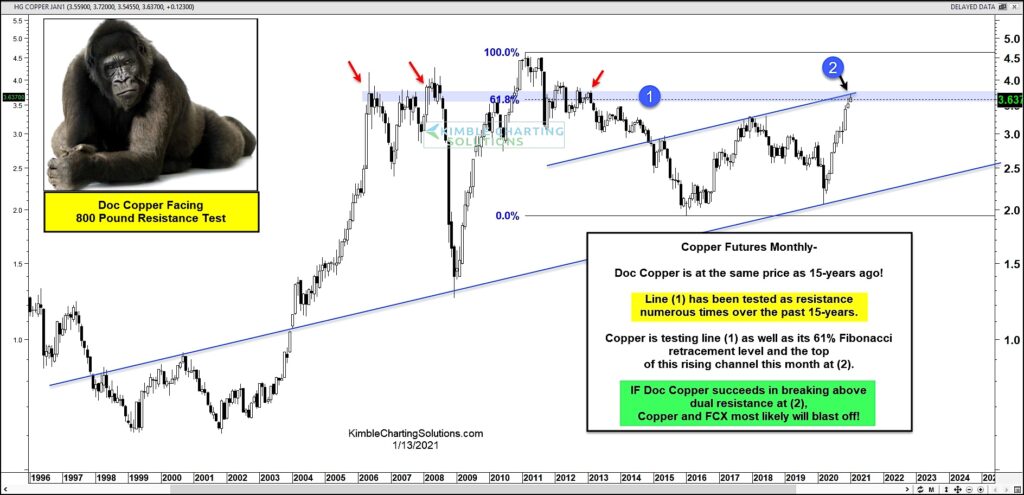
The long-term “monthly” chart highlights Copper’s multi-month thrust higher. It also shows Copper futures prices hitting a significant band of triple resistance this month. Line (1) has been tested several times over the past 15 years, while resistance at (2) is made up of 61.8 Fibonacci resistance as well as the top of the rising channel.
So what will Doc Copper do with this 800 pound test of resistance?
Well, if copper succeeds in breaking above this band of resistance, it will likely mean blast off for copper and copper stocks like Freeport McMoran (FCX). Stay tuned!
Copper Futures “monthly” Chart
Note that KimbleCharting is offering a 2 week Free trial to See It Market readers. Just send me an email to services@kimblechartingsolutions.com for details to get set up.
Twitter: @KimbleCharting
Any opinions expressed herein are solely those of the author, and do not in any way represent the views or opinions of any other person or entity.
")

 Testing Important Price Support")
")
