Note that this post with written with my friend Arun Chopra of Fusion Point Capital.
Last Halloween we shared some spooky charts.
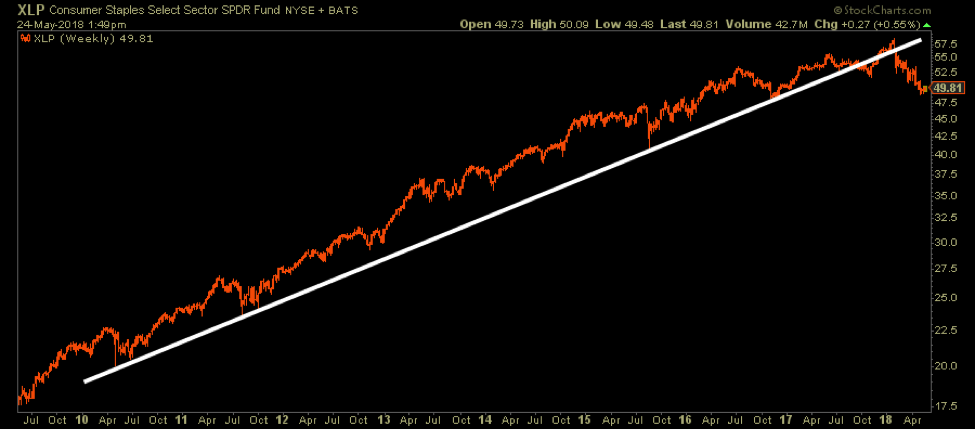
On the top of that list was Consumer Staples breaking its long term up-trend. Since then, it’s broken below the prior low, confirming the broken trend.
Price is now testing the 2016 low area of 48. It will be worth watching that level in the months ahead.
Let’s dive further into the sector.
The following chart looks at the relative strength of Staples (Staples vs the broad market), Treasury Rates, and the relative strength of Technology to the underlying relationship. As interest rates have risen, money has flown out of defensive sectors such as staples and into risk-on groups such as technology. When we look at it from a relative strength basis the rotation becomes much more clear.
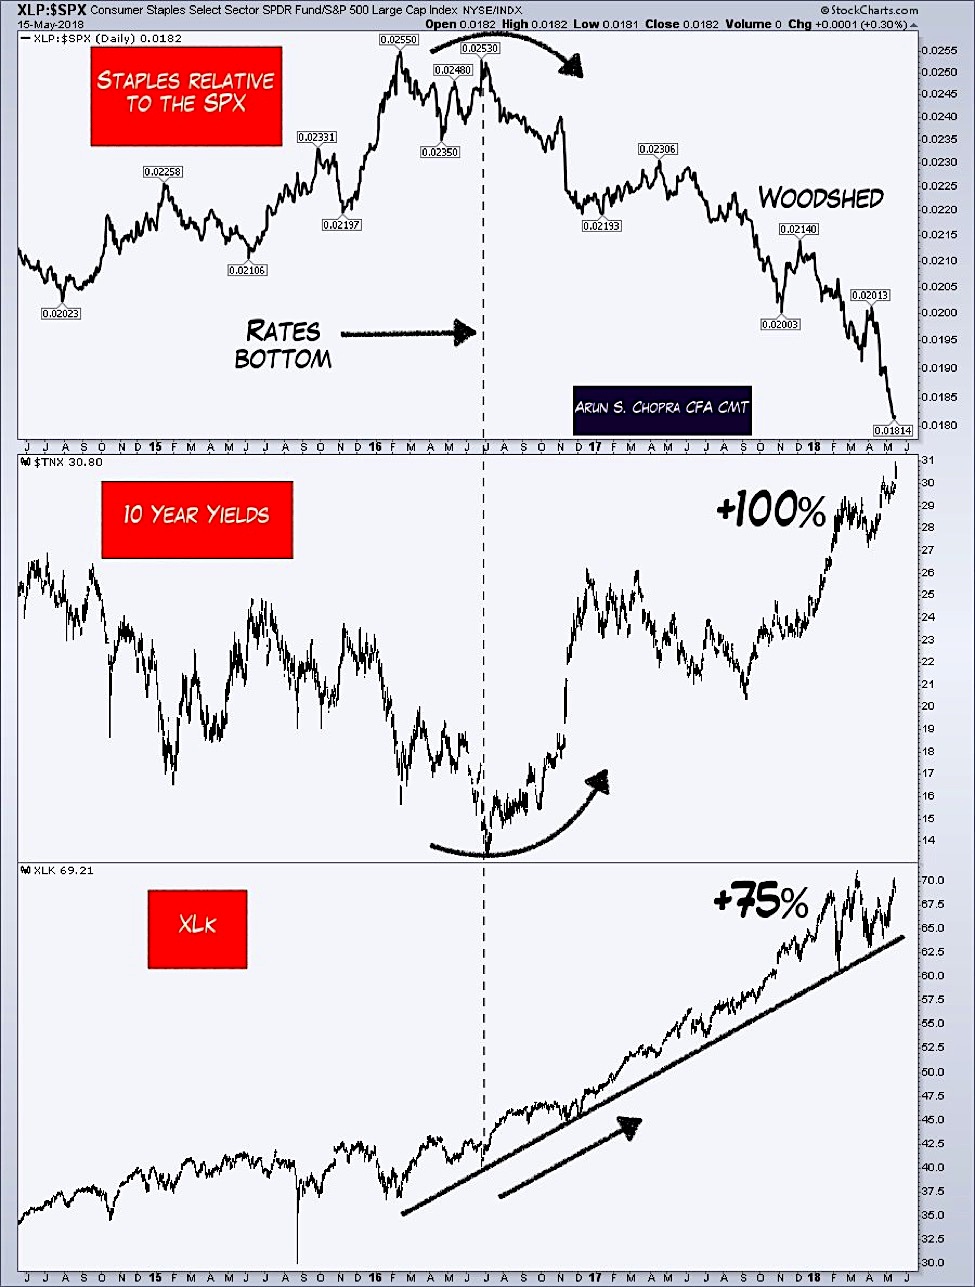
Although the S&P 500 hasn’t made a new high since January, money continues to flow in a “risk-on” manner. If you want to invest in Staples, you’re fighting current flows.
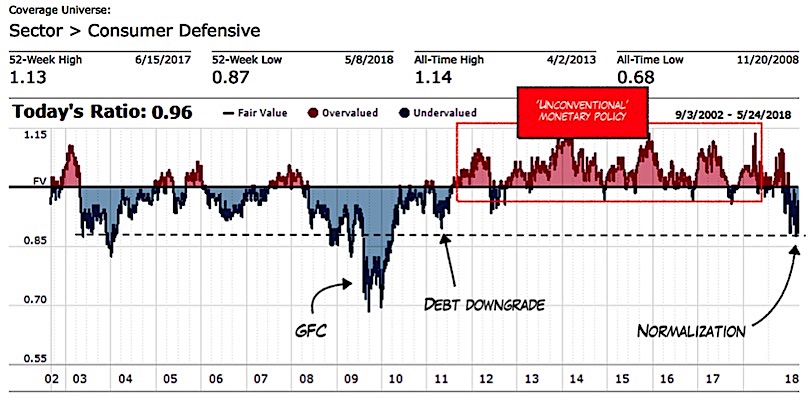
Staple Valuations have come in since monetary policy ‘normalization’ began and are relatively attractive compared to the last 20 years or so. The question becomes is are these value traps? Are there bargains to be had? Or will momentum, trend, and current policy continue to weigh on the group?
While valuations have improved, technicals in individual names are still mixed as well.
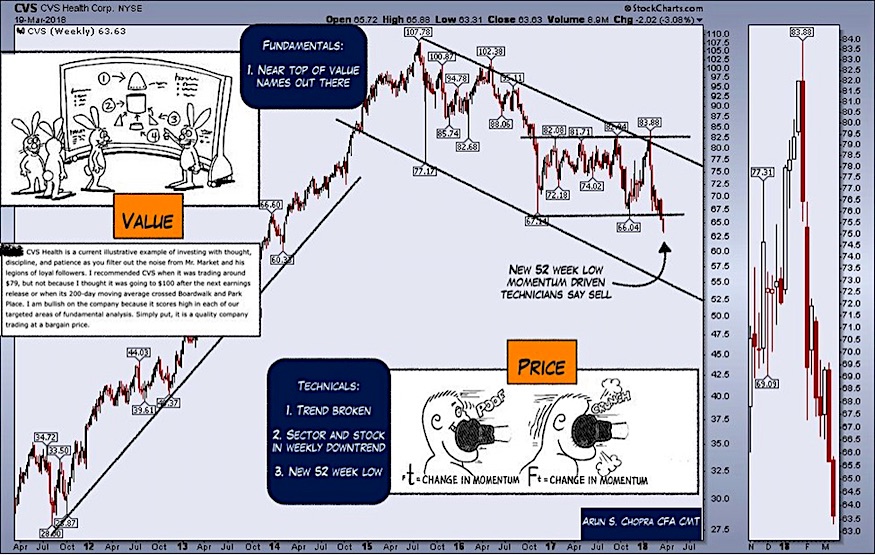
CVS recently broke its trading range lower. Currently, price is re-testing the break down area within a dominant downtrend. An interesting thought below is how valuation and price can often tell two different stories.
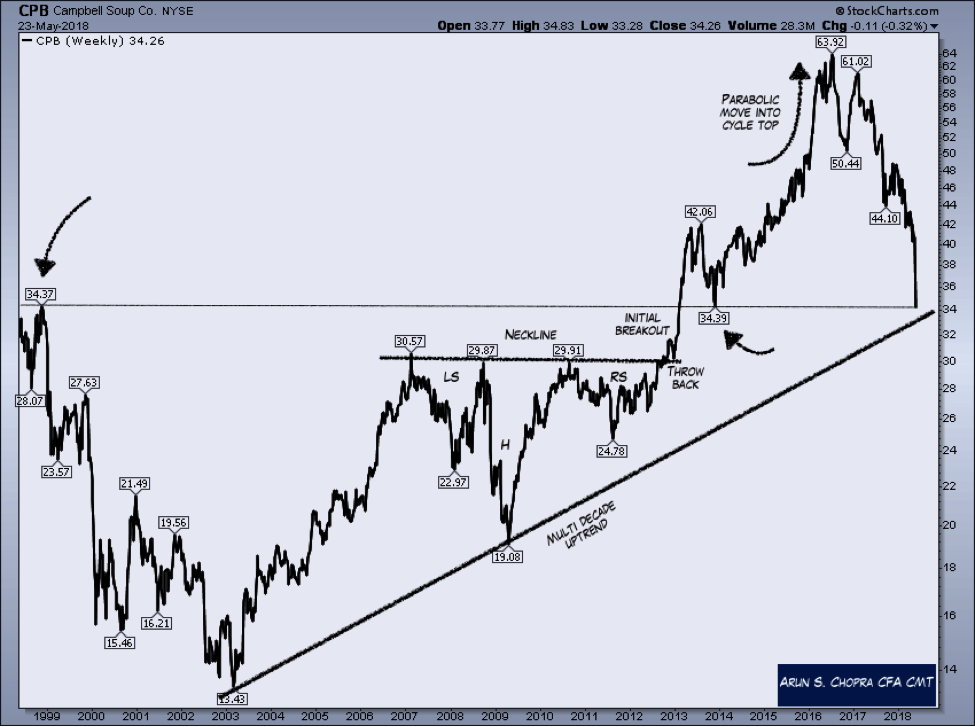
Campbell Soup’s epic drop has come to the forefront lately. Shares have fallen 45% from the 2016 high, but it’s worth noting we’re nearing long term support areas. The risk/reward is much improved for bulls.
To sum it up, the Consumer Staples group is certainly more attractive than it was 6 months ago. That said taking long positions here is fighting price and money flow trends. That’s a tough game to play, but properly aligned risk-reward based decisions give you a fighting chance.
Twitter: @ATMcharts @FusionPtCapital
Any opinions expressed herein are solely those of the author and do not in any way represent the views or opinions of any other person or entity.


