Note that this post with written with my friend Arun Chopra of Fusion Point Capital.
In the spirit of Halloween we wanted to take a look at some of the spookiest stock charts in the market right now. The bulls have had there way with this market, but there are still some hideouts for bears on Halloween.
Let’s dig in. Here’s 5 spooky charts to be mindful of on Halloween.
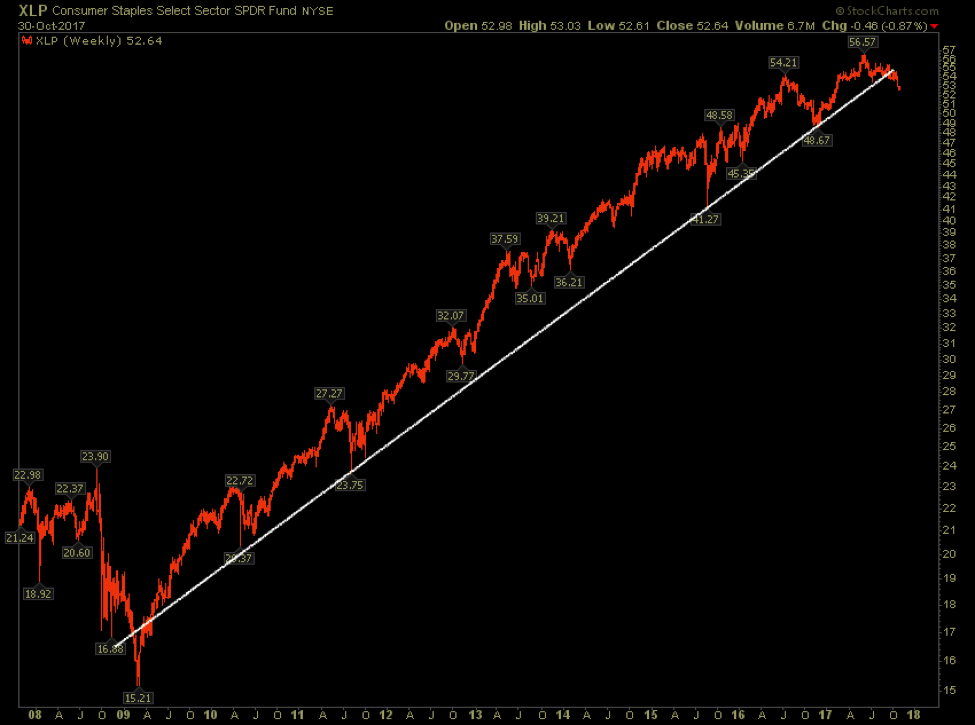
1. The Trendline Break: Consumer Staples (XLP)
The Consumer Staples (NYSEARCA:XLF) have been one of the best performing sectors since the start of the bull. The last few trading weeks have seen all of that change. A year long top has formed and now the 2016 high has been lost and the multi year uptrend has broken.
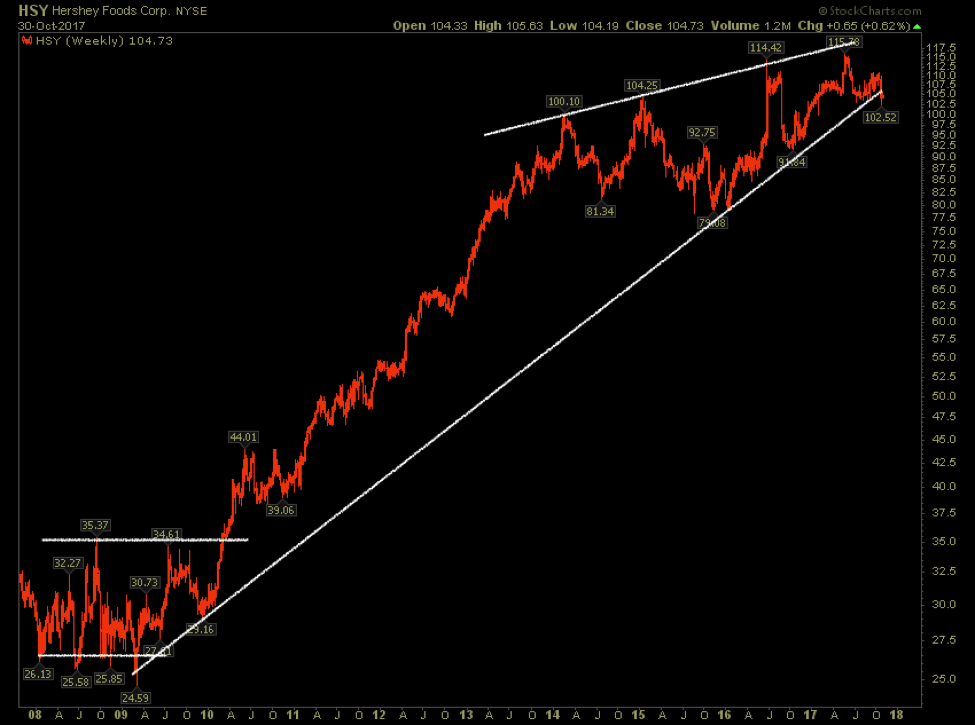
2. The Bearish Wedge: Hershey Foods (HSY)
We see the consumer staples as a group are under pressure and Hershey Foods (NYSEARCA:HSY) is one of the more vulnerable stocks in the group. Enjoy your chocolate, but beware of the stock.
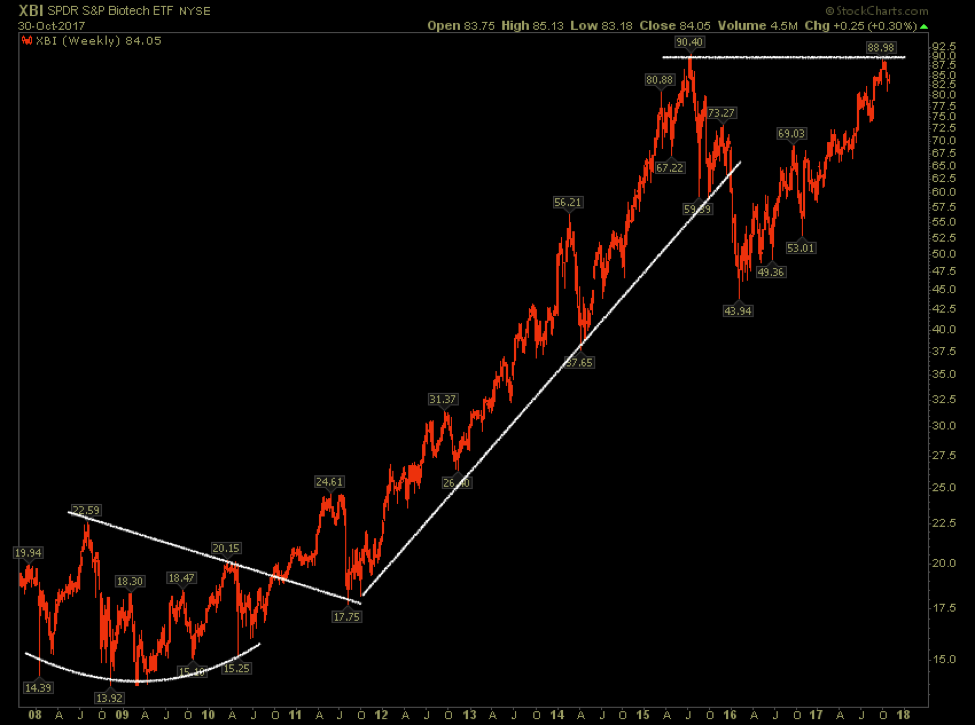
3. The Double Top: Biotech Sector (XBI)
Biotechs (NYSEARCA:XBI) went on a major run from ’09-’15, leading into what was essentially a blow off top. After the nearly 60% decline, the index has rallied back to resistance. How far does Biotech correct? Could this be a double top?
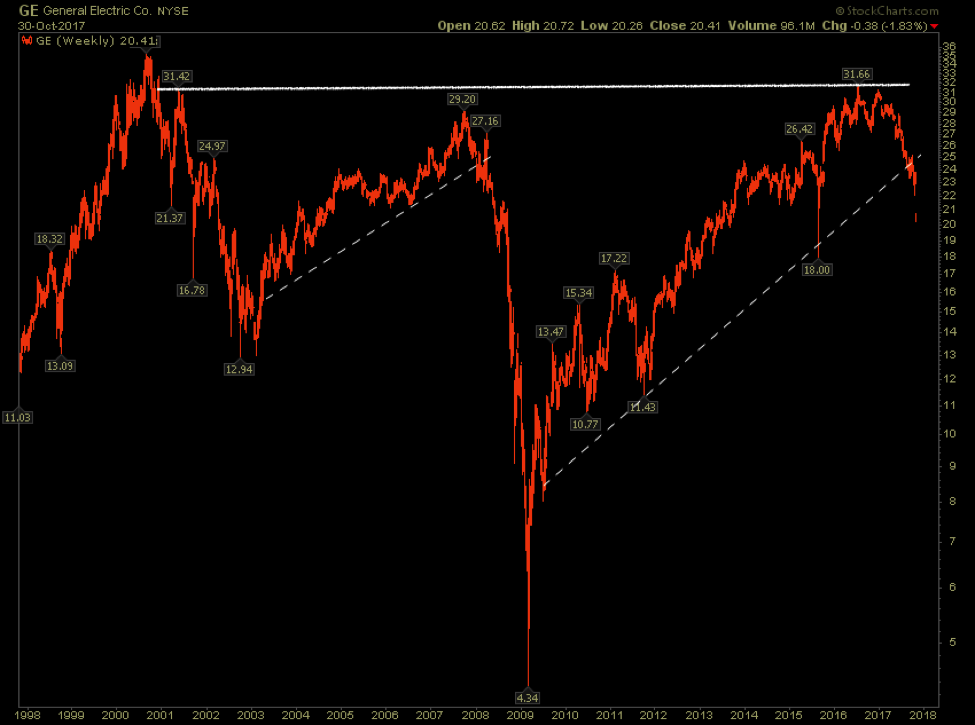
4. The Relative Strength Laggard: General Electric (GE)
General Electric’s stock (NYSE:GE) had noticeably underperformed the entire market for years unable to get through its highs from 2000 and 2006. Now the price has started to break trend. In a market making new highs, this is as scary as it gets for a shareholder.
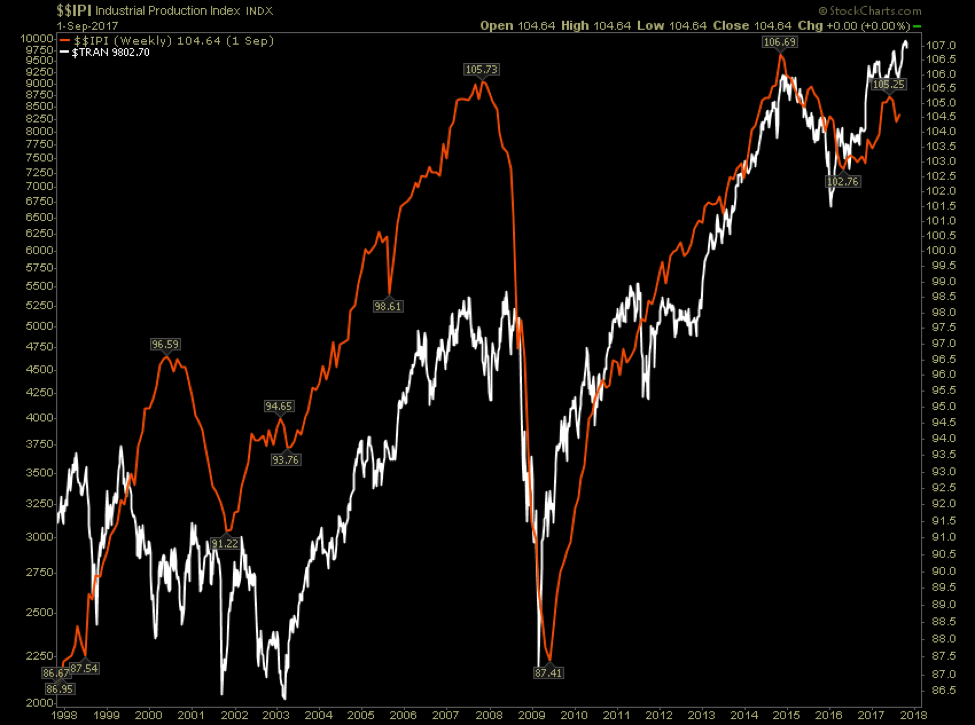
5. The dangerous divergence: Industrial Production vs Transports
Industrial production and Transports are often highly correlated. The transports have gone on to new highs while the industrial production level is still below its cycle highs.
Trade safe. Happy Halloween everyone!
Twitter: @ATMcharts @FusionPtCapital
Any opinions expressed herein are solely those of the author and do not in any way represent the views or opinions of any other person or entity.


