Traders should trade carefully in the SPDR Consumer Discretionary ETF (XLY)
The Consumer Discretionary SPDR ETF (NYSEARCA: XLY) may offer some good trading opportunities in the later part of 2017 and beyond. In this post we examine some scenarios and show how traders working on different time frames can make use of Elliott wave methods to plan their trades.
As always, we approach the chart by trying to identify the major landmarks in whatever pattern it presents. The prolonged and consistent move upward from 2009 had very little overlap, suggesting it represents one or more impulsive structures. Impulsive structures consist of five sub-waves.
Within a developing impulsive pattern, we might then look for one of the tell-tale signs that the structure is nearing completion. The most common sign is a strong move followed by a period of sideways consolidation that eventually breaks in the direction of the trend. Typically that represents a third wave transitioning into a fourth wave and then a fifth (terminal) wave. In XLY, the consolidation that lasted from mid-2015 until late 2016 looks like a possible fourth wave, with the subsequent rally being part or all of a fifth wave.
Beyond the major landmark that the fourth wave in XLY seems to have established, we lose the benefit of hindsight and must consider different scenarios. We know the rally out of the fourth wave should itself consist of five sub-waves, but it is not clear whether the fifth wave began at the low that occurred early in 2016 or the one that occurred late in 2016. The distinction is important even though the answer is yet unknown.
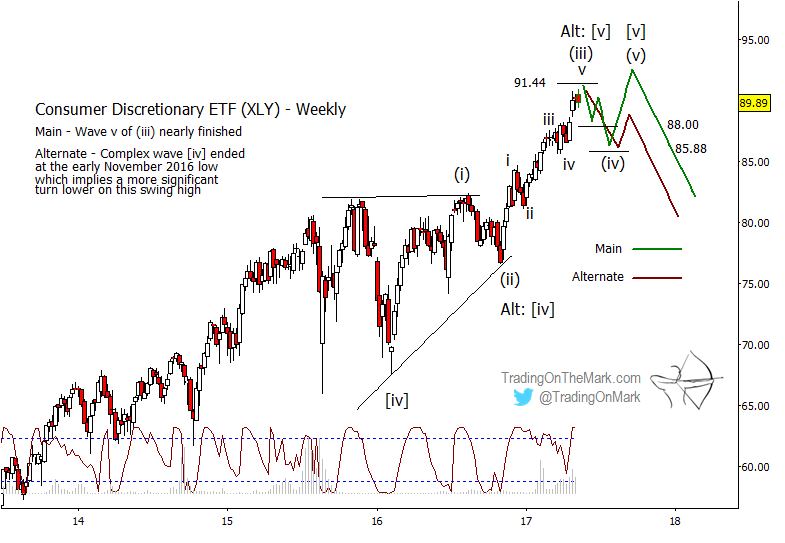
Is the sequence of five sub-waves complete as XLY approaches its current area of resistance (91.44 to 92.11)? If the sequence began in early 2016, which we believe is somewhat more likely, then the current high looks best as a wave (iii) – in other words the penultimate high that would be followed by the actual high. That is the main scenario, which we have drawn on the chart in blue.
If the sequence of five sub-waves actually began near the end of 2017, then it is possible to count five waves already present in the structure. Our alternate scenario, drawn in green, reflects that view and implies that the current peak is the terminal high.
How you trade this Elliott wave pattern depends on where you stand. If you entered and have stayed in a long position since 2016 or even earlier (Congratulations!) then you are considering how to maximize the profits you take while limiting the risk that the trade will start going against you. The analyst (us) somewhat favors the scenario of one more high. You might take partial profits near current resistance that might represent the top of sub-wave (iii) and then wait for sub-waves (iv) and (v) to play out before exiting completely. You might also draw a line in the sand for how low a declining wave (iv) can go and still be viable. In our main scenario, that line probably lies near the previous fourth wave of smaller degree, or in the area that includes supports at 88.00 and 85.88.
If you are still feeling bullish when price approaches the support area, then you might consider whether your trading style is compatible with catching the relatively small upward swing that would represent sub-wave (v). The move might last a few months, and it might not rise very far above the high of sub-wave (iii). One factor that makes this small upward trade somewhat favorable is that you would know approximately where to place protective stops – just beneath the support area.
On the other hand, if you are currently not in a position, or if you favor a long-term bearish view, then you might want to see some confirmation on the charts before taking a short position. Shorting from the current price level carries substantial risk, because the upward pattern might not be complete. The pattern could extend directly upward beyond nearby resistance, or it could make a downward retrace and then bounce higher.
The best scenario for a bearish trader would be for price to sink beneath the support area and then climb back to retest the area from below. That would allow the trader to take a position ahead of what could be a strong downward move, while also treating the broken resistance as a guide in placing stops.
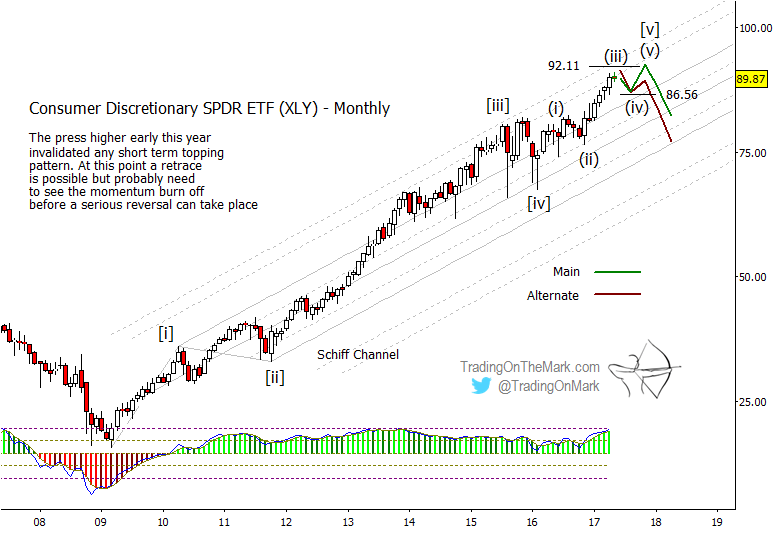
Channel geometry and a prior resistance level (now potential support) at 86.56 also offer some guidance for the trades. Potentially bullish traders might watch for price to bounce from the main upper boundary of the channel or from the broken resistance level to try for one more high. Bearish traders would watch for those areas to break later in 2017 and possibly be retested from below.
Keep up to date with market inflections by following us on Twitter and facebook! Thanks for reading.
Twitter: @TradingOnMark
No position in any of the mentioned securities at the time of publication. Any opinions expressed herein are solely those of the author, and do not in any way represent the views or opinions of any other person or entity.


