Commodities have been the talk of the town over the past several months, with grains, energy, and metals reaching new multi-month highs over the 12 months.
And this has lead to concerns over input costs… and inflation.
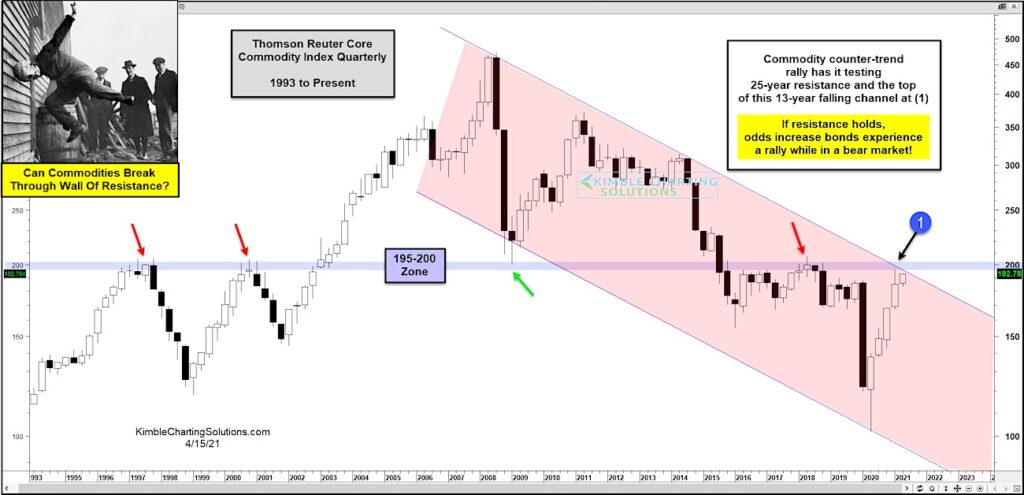
That’s where today’s chart comes into play. It is a 25+ year “quarterly” chart of the Thomson Reuters Core Commodity Index.
As you can see, commodities have been in a broad downtrend channel since peaking in 2007-2008. As well, the 25-year stretch has produced an important support/resistance pivot line (marked by red & green arrows).
So why does this matter to the Commodity Index and several select commodities showing strength?
Because the current 5-quarter rally in commodities is testing this important pivot (now resistance). And at the same time, it is testing the top of its 13-year falling price channel at (1).
If resistance holds, inflation may be held in check and bonds may experience a bear market rally. But if commodities breakout, then inflation concerns will continue to rise and select commodities showing relative strength will continue higher. Stay tuned!
Note that KimbleCharting is offering a 2 week Free trial to See It Market readers. Just send me an email to services@kimblechartingsolutions.com for details to get set up.
Twitter: @KimbleCharting
Any opinions expressed herein are solely those of the author, and do not in any way represent the views or opinions of any other person or entity.

: Showing Some Signs of Emerging Strength")
