Commodities Index Equal Weight “monthly” Chart
After a 9 year tail-spin, Commodities are starting to show life in 2020.
Precious metals have been very strong, and commodity bulls are hoping the grains (and energy) follow suit.
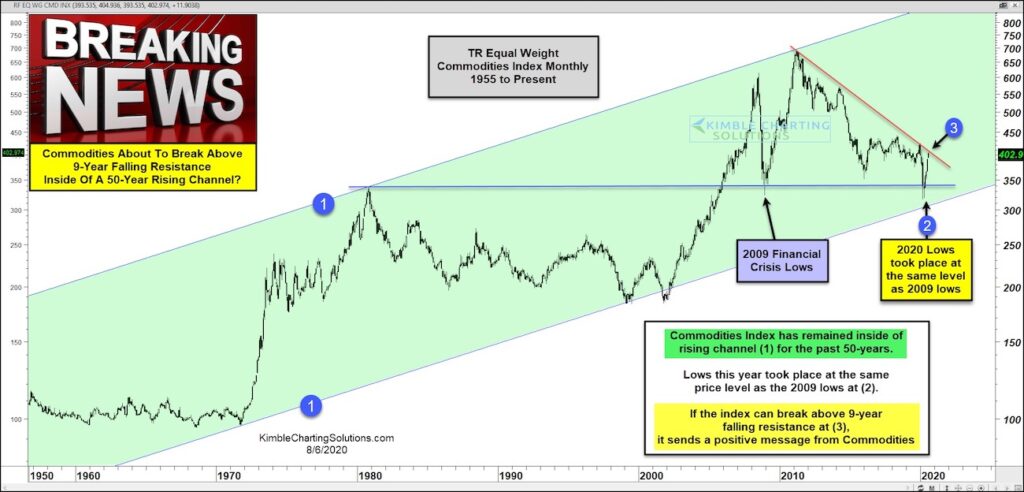
In today’s chart, we look at a long-term “monthly” view of the Thomson Reuters Equal Weight Commodity Index.
As you can see, the index has been in a rising channel marked by each (1) for the past 50 years. The 9 year downtrend touched down near channel support while retesting the 2009 lows at (2).
The rally in 2020 has commodity bulls feeling good again. The Commodity Index is now testing the 9 year downtrend line at (3).
A breakout above falling resistance would be very bullish for commodities.
9-year breakout test while inside of a 50-year rising channel for commodities. Stay tuned!
Note that KimbleCharting is offering a 2 week Free trial to See It Market readers. Just send me an email to services@kimblechartingsolutions.com for details to get set up.
Twitter: @KimbleCharting
Any opinions expressed herein are solely those of the author, and do not in any way represent the views or opinions of any other person or entity.


: Showing Some Signs of Emerging Strength")
