Rewind to March 2020 and things weren’t looking so good for commodities. COVID-19 was in the news and several assets were trading sharply lower.
Then came the comeback. And in a big way. Perhaps even concerning way when you fast forward to today.
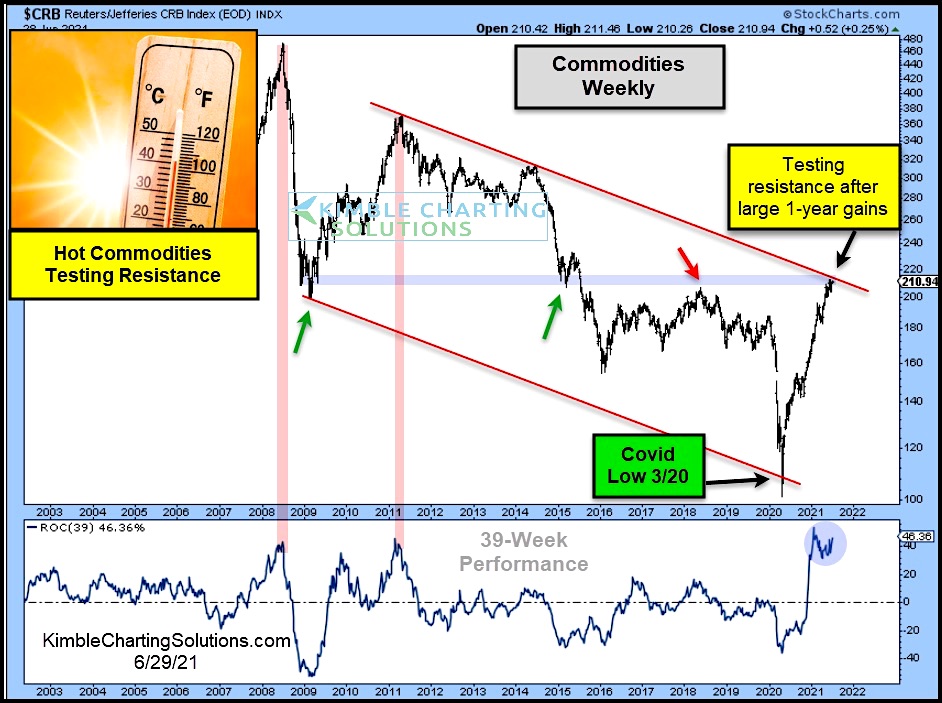
As you can see in today’s “weekly” chart of the CRB Commodity Index, price has remained within a broad downtrend channel (marked by each red line).
But as you can see, an overheating economy and supply issues have pushed the commodity index to new 5 year highs. And it is testing its overhead trend resistance line. A breakout would be bullish for the broader commodity markets, but would also be a concerning inflationary signal.
On the flip side, the Rate Of Change (ROC) indicator is warning that commodities have traveled too far, too fast… and a pullback could be around the corner. The last two times commodities rallied nearly 50% in a year, they cooled off for several months.
Will it be different this time around? Stay tuned!
$CRB Commodity Index “weekly” Chart
Note that KimbleCharting is offering a 2 week Free trial to See It Market readers. Just send me an email to services@kimblechartingsolutions.com for details to get set up.
Twitter: @KimbleCharting
Any opinions expressed herein are solely those of the author, and do not in any way represent the views or opinions of any other person or entity.

: Showing Some Signs of Emerging Strength")
