After a parabolic like move early in the year, Starbucks (SBUX) has spent the better part of the past 4 months hanging out above the long term bullish channel… that is until earnings came. The post earnings breakdown has flushed the stock back into the channel and towards the lower support (which happens to be long term support). Bulls would like to see 45-46 hold.
Note the 3 day dip below the wedge platform on the daily chart… this may have been a clue. See charts below.


Starbucks (SBUX) stock charts with technical analysis overlay as of July 27, 2012. Price support and resistance levels with trend lines and defined bullish channel. Long term support trend line. Coffee Retailer stocks. Starbucks stock ticker is SBUX.
———————————————————
Twitter: @andrewnyquist and @seeitmarket Facebook: See It Market
No position in any of the securities mentioned at the time of publication.
Any opinions expressed herein are solely those of the author, and do not in any way represent the views or opinions of his employer or any other person or entity.

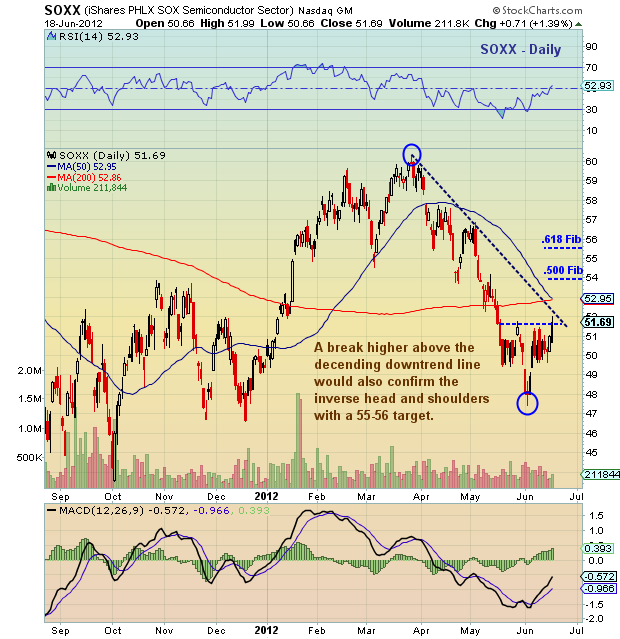
: Important Breakout Retest")


