 By Andrew Nyquist
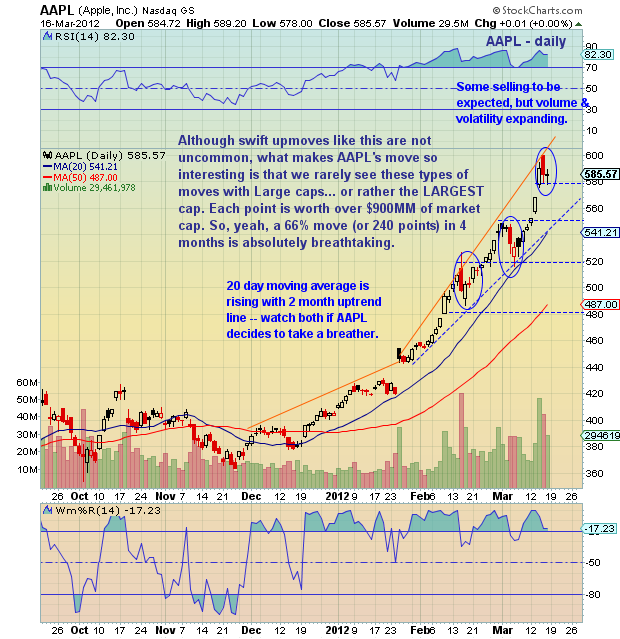
Apple’s (AAPL) 240 point stock move in 4 months can be summed up as follows: Each point is worth over $900MM in market cap — WOW! Puts things in perspective, as well as putting Apple in a league of its own. With everyone calling for a top here, I’ll avoid the subject and just say prudent risk management is always advised. Have a plan and don’t be afraid to bank a few bucks with a little scale and trail. Good luck.
**Other technical stock charts found here.
Note: Tagged and searchable under “chartology.”
Apple (AAPL) annotated daily stock chart with technical analysis overlay as of March 16, 2012. Price support and resistance levels. Tech stocks. Stock price soaring. Parabolic. AAPL
———————————————————
Your comments and emails are welcome. Readers can contact me directly at andrew@seeitmarket.com.
Twitter: @andrewnyquist and @seeitmarket Facebook: See It Market
No positions in any of the securities mentioned at the time of publication.
Any opinions expressed herein are solely those of the author, and do not in any way represent the views or opinions of his employer or any other person or entity.


