Markets are shifting, should your trading strategy too?
Mish is at the Money Show, so I am filling in for two days till she returns, and I already managed to miss her Daily...
Will Semiconductor Stocks Send a Trick or Treat Message to Tech Sector?
The 2022 bear market has seen the technology sector lead the market lower.
This is apparent when looking at the performance ratio of the Nasdaq...
Financial Sector ETF (XLF) At Make-Or-Break Resistance
The banks are an important part of the economy and stock market. As Todd Harrison used to say, 'so go the piggies, go the...
Junk Bonds Reversal Would Be Bullish For Stocks!
With yields trading at elevated levels and stocks trading at depressed levels, it makes sense that junk bonds are not faring well this year.
BUT...
MBS, Convexity Vortex, and a Silver Lining For Bonds
Many investors fail to understand the nuances and complexities of Mortgage-Backed Securities (MBS). As a result, few can appreciate institutional MBS investors’ role in...
A Surprisingly Upbeat Q3 Corporate Earnings Season Kicks Into High Gear
The following research was contributed to by Christine Short, VP of Research at Wall Street Horizon.
Key Takeaways:
S&P 500 EPS growth for Q3 is set...
Are Silver Miners (SIL) Nearing A Tradable Breakout?
The precious metals arena has seen gold and silver pullback and consolidate for several months. And this, coupled with a bear market in equities...
U.S. Stocks Reach Resistance Decision Point
The recent rally in U.S. equities saw the S&P 500 Index, Nasdaq 100 Index, and Russell 2000 Index turn up from our MOB price...
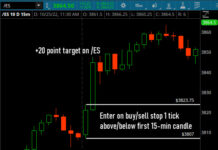
One Trade to Rule Them All: The 15-min Opening Range Breakout
If you’re looking for a straightforward trade that you can take every day to consistently gain an edge you're in the right place. This...
Copper/Gold Ratio Says Bond Yields Rally Overdone
The price of copper to gold has been a correlation that has followed 10-Year US Treasury bond yields (in trend) fairly closely.
This correlation has...


