The banks are an important part of the economy and stock market. As Todd Harrison used to say, ‘so go the piggies, go the poke.’
The market ended the week on a high note and the Financials were in the thick of the rally.
Today, we look at the Financial Sector ETF (XLF) and highlight why it’s trading at a critical spot heading into this week and why the outcome is important for market participants.
Note that the following MarketSmith charts are built with Investors Business Daily’s product suite.
I am an Investors Business Daily (IBD) partner and promote the use of their products. The entire platform offers a good mix of analysts, education, and technical and fundamental data.
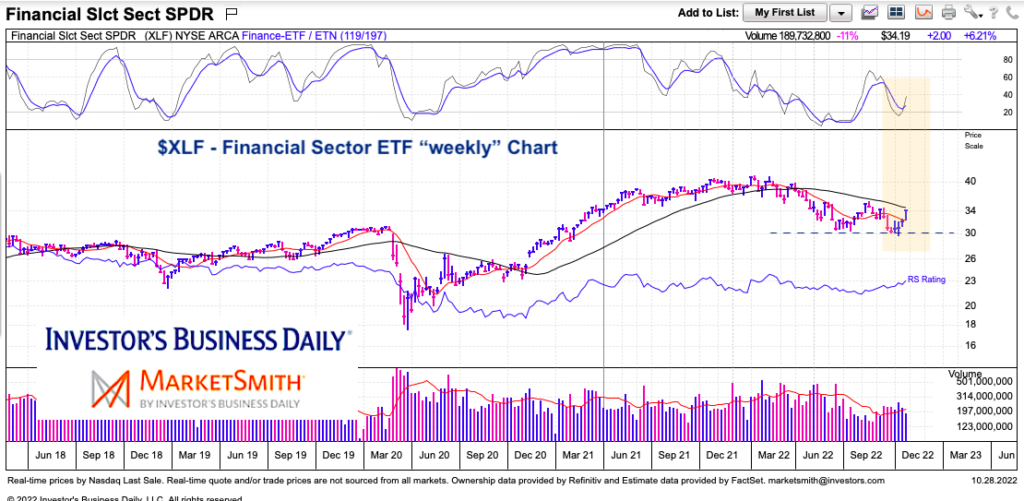
$XLF Financial Sector ETF “weekly” Chart
Pretty simple chart here. As you can see $XLF has found support at the pre-COVID highs and the latest rally attempt has the ETF trading just below its 40-week moving average. Notice as well that momentum is trying to curl higher.
That said, this is a weekly chart so we’ll need to see how price fares at the end of the week (or each week) before making any assumptions. We are still in a bear market and there is plenty of work to do. Let’s see what happens this week.
Twitter: @andrewnyquist
The author may have a position in mentioned securities at the time of publication. Any opinions expressed herein are solely those of the author, and do not in any way represent the views or opinions of any other person or entity.

: Worrisome to Broader Market?")

