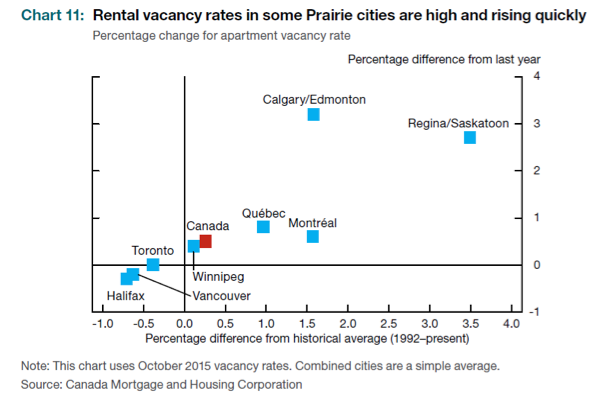
It is also important to note that weakness in the commodity-related economy is filtering through to housing. In AB, SK and NL, annualized resales are down and prices are contracting. Moreover, rental vacancy rates in those areas are rising.
Another notable fact is that the GVA and GTA account for one-third of the value of the Canadian housing market, as well as one-third of the mortgage market’s value. Higher property values and incomes are to be expected in big cities. That said, if one or both of those regions begin to roll over economically then the rest of the country and the financial system will be under pressure.
Major Risks
As we have outlined, the Canadian economy and housing market appear vulnerable. That is not to say that we are about to go into a prolonged recession; however, there are substantial risks that could push us in that direction. One risk is that mortgage rates will rise, escalating the cost of debt service. This would be negative for the economy because it would put even more pressure on our highly indebted households. However, in our view, that is not very likely. Although the U.S. is moving towards tighter monetary policy, Canada is not. Moreover, 5-year yields, which most mortgage rates are tied to, are low and seem well contained. Our economy is already suffering because of weakness in the oil patch. As such, we do not expect the Bank of Canada to raise rates anytime soon.
The other risk is that the country goes into recession as a result of continued weakness in commodities and lower demand from the emerging markets. In this case, broader and increasing unemployment would reduce the ability of households to service their debts. This would be particularly bad for the highly leveraged households we referred to earlier.
Our view is that housing is increasingly being purchased using a “cash flow” model whereby consumers determine the total cost of the property based on their ability to service the monthly mortgage payments, disregarding the absolute levels of debt they will take on to do so.
A purchaser who is able to spend $1000/month on a mortgage can service a $170,000 mortgage at 5% (with a 25-year amortization period). Drop the interest rate to 2.5%, and that same $1000/month now services a $230,000 mortgage. A standard 25% down payment would drive the price of a house from $266,600 to $306,000. And that assumes the purchaser does not choose to spend more than the $1000/month. Low interest costs have made housing seem more affordable than it actually is. As you can see in the following chart, the interest only debt service ratio (red line), which measures interest payments relative to debt, has been in decline since Q1 of 1990.
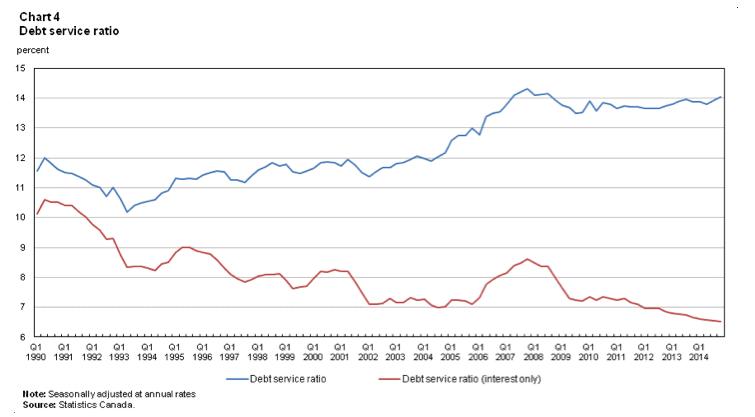
Meanwhile, the total debt service ratio (blue line), which includes both principal and debt, has been relatively flat for the past eight years. This means that people are taking on, and paying for, more principal than they did in the past.
The CMHC has made some real steps to curb this by limiting amortization periods to 25 years and by increasing minimum required down payments. Both of these actions force borrowers to pay down their debts faster. Even so, the reality is that debt loads are already very high.
Mortgage rates are determined by the bond market. With the benchmark Canada 5-year bond yield at 0.65%, borrowing rates could go lower, but not by much. While we don’t foresee materially higher rates in the near term, we feel the tailwind of dropping rates is played out.
A weaker employment backdrop would make debt service even more difficult than it already is. If that transpired then we would expect defaults to rise and home prices to fall. That would have a negative impact on household wealth with debt/asset ratios rising due to falling assets. This would also be negative for consumption since rising defaults would cause both lenders and spenders to retrench.
Economic weakness is evident in Alberta and Saskatchewan. If it spreads to the rest of the country then we would be especially cautious about the Canadian housing market.
The Mortgage Market
As of May 2015, the total amount of mortgages outstanding was $1.5 trillion, 87% of which was residential. The vast majority (85-90%) of these mortgages are originated by federally or provincially regulated entities. Only ~5% are originated by unregulated lenders. Still, mortgage credit growth at less-regulated entities continues to be strong.
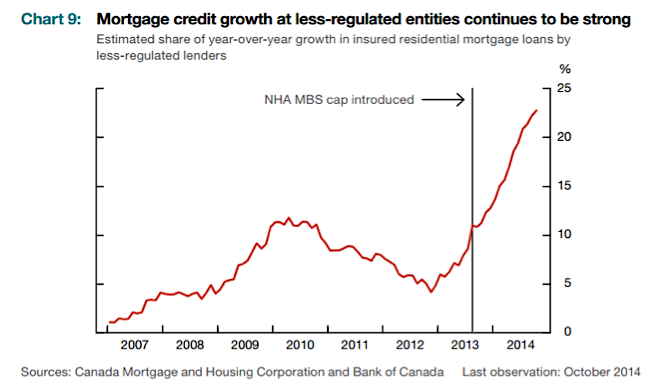
This is worrisome because, for these lenders, there are no legislated reserve requirements or limitations on LTV ratios. As such, it is reasonable to assume that they deal with riskier mortgages.
Mortgage Investment Corporations
Mortgage investment corporations (MICs) account for the majority of unregulated mortgage lending in Canada. Fundamental Research Corporation built a database of 72 entities that operate as MICs or have similar structures. They found that their total holdings amount to at least $6.74 billion or 0.45% of the total market. MICs specialize in short term (6 to 24 months), high yield mortgages. At least 40% of their assets must be invested in residential mortgages, cash and CDIC insured deposits. They pay no corporate tax and act as a flow through entity – i.e. they payout 100% of their income as distributions to investors (who are left with the tax burden). As such, the value of their shares should remain the same unless they suffer capital losses. MICs earn interest and fees (origination, renewal and cancelation) from borrowers. In order to fund themselves, MICs borrow from banks and issue equity to investors.
We consider MICs riskier than other housing derivatives for reasons we will address later in this paper. Still, there are multiple differences between firms. We are building a proprietary database which compares both private and public MICs on a variety of metrics. Here is a brief summary of our findings:
MICs vary in terms of…
- Fund size: Some public firms are closing in on $500 million AUM while other private ones have fewer than $50 million under management
- The number of loans: Some firms have hundreds of them while others have fewer than 30
- Allocations towards first and second mortgages: First mortgages are safer than second mortgages because they represent a priority claim on the property that secures the mortgage
- Average loan-to-value ratios (LTV): Range from ~35% to >70%
- Average loan size: Ranges from <$100,000 to $7,500,000
- Average term: Ranges from 0.6 to 4.9 years
- Geographic exposure: Most companies tend to focus on Ontario, but to varying degrees
Like all investments, MICs vary in quality. Some are geared to maximize income while others emphasize capital preservation. Even so, we are cautious on the space as a whole. The two biggest risks for MICs are non-performing loans (NPLs) and fraud. These firms have been performing well in recent years; however, it is important to consider the underlying fundamentals of real estate in general. The Canadian housing market has been in a bull market for a long time. If unemployment rises and home prices fall then it is reasonable to assume that the number of NPLs will increase. Fraud is also an elevated risk because of the lack of oversight in the unregulated market – both on the lending side and the investment side.
We are also skeptical about MICs for structural reasons. One issue is that they are reliant on financing to grow. In addition, managers have an incentive to grow their asset base because they are mostly paid based on AUM. Since all profits are paid out, asset growth has to come from making new loans. This makes MICs vulnerable to falling demand from investors, rising borrowing and financing costs and waning support from the banks.
Another problem is a lack of loan-loss reserves. The Office of the Superintendent of Finance (OSFI), the regulator overseeing the MIC structure, requires that substantially all profits are paid out to investors, leaving little in the way of reserves to protect against defaults. If defaults rise then mortgage values will be impaired and MICs will have limited means to protect their holdings. In our opinion, that would result in immediate gating (when the fund does not allow redemptions). For example, one of the firms we looked at had a $3.6 million provision for losses at the end of Q3’15 vs. $459 million of mortgages receivable.
Conclusion
Canada is vulnerable because its households are heavily indebted and its housing market is overheated. The CMHC just released its quarterly Housing Market Assessment report, which found the following among its conclusions: “Overvaluation and overbuilding are the most prevalent problematic conditions observed across the 15 centres covered by the HMA. Overvaluation is detected in 8 centres while overbuilding is detected in 7”. The full report is available here.
The major risk is that the economy falters and unemployment rises, leading to deterioration in the household’s ability to service their monthly mortgage payments. In terms of MICs, we remain guarded. We would not advise chasing for yield at the expense of stringent lending standards, and would favour the most transparent structures as well. Yes, there are vast differences in quality across the space. Nonetheless, we would expect them to underperform relative to other housing investments if and when the Canadian housing market begins to weaken.
Thanks for reading.
This post was written by James Price and Shane Obata.
Twitter: @sobata416 and @JP_RGMP
Get more research and analysis from Richardson GMP
Any opinions expressed herein are solely those of the authors, and do not in any way represent the views or opinions of any other person or entity.

 Flirting With Critical Support… Again")


