The Canadian housing market has done extremely well for a very long time. As such, many people expect the trend to continue. That said, there are major vulnerabilities in the Canadian economy that pose a threat to the housing market’s continued success.
In the following report we will examine the economy, the financial position of households, the Canadian housing market and the risks facing it.
Lastly, we will analyze the mortgage market and Mortgage Investment Corporations (MICs). We are not convinced that the housing market is about to crash. Nonetheless, we remain extremely cautious.
Overview
2015 was a rough year for Canada as falling commodities, specifically oil, filtered through to the rest of the economy. In real terms, GDP has been almost flat since late 2014 – shortly after oil started its long decline.
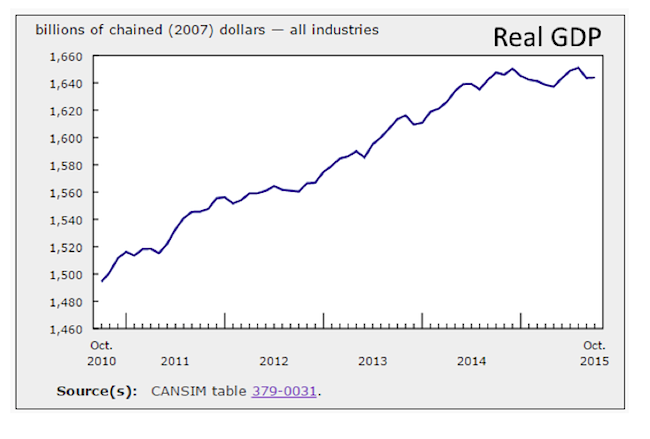
Source: Statistics Canada
The economy, however, is still holding up. Part of the reason for its resilience has been the strength of the Canadian housing market. Two regions have been leading the pack – the Greater Vancouver Area (GVA) and the Greater Toronto Area (GTA). According to the Canadian Real Estate Association (CREA), home prices increased by 17.83% and 10.29% from Nov’14 to Nov’15 in the GVA and GTA, respectively.
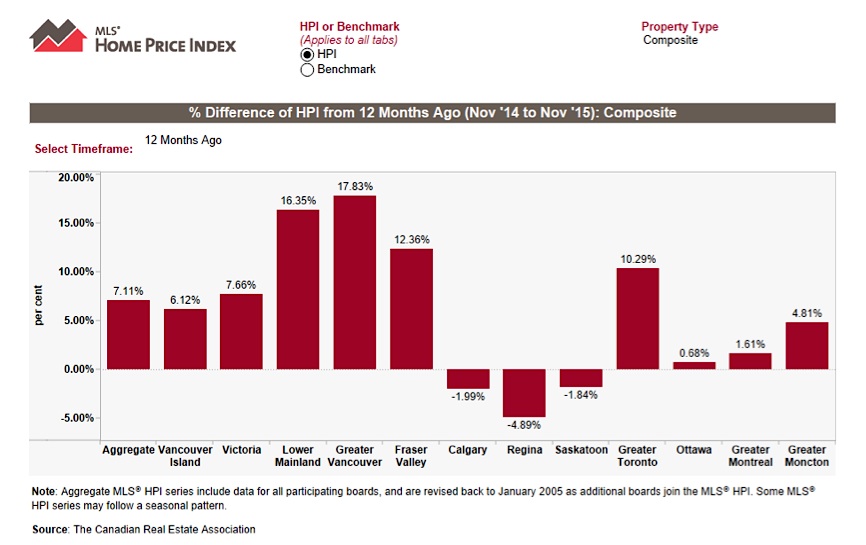
And that is just for the past year. We will get into more details later in this report. For now, it is important to realize that the Canadian housing market has been booming for a long time. There are, however, serious risks to its continued progress that we wish to explore…
Excessive Debt
Our dependence on commodities is one thing. Our reliance on debt is another. The first “vulnerability” the Bank of Canada (BoC) mentioned in its Financial System Review for Dec’15 was excess household debt. Remarkably low interest rates have encouraged borrowing. What is concerning is that individuals have been borrowing to spend on housing. As a result, debt growth has outpaced income growth. The following chart indicates that the debt-to-income ratio (red line) has continued to edge higher:
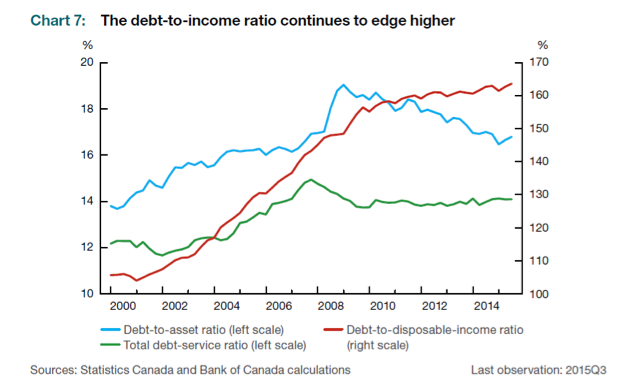
This trend calls into question the sustainability of rising home prices. When prices go up, people are required to borrow more to afford housing. This makes them more vulnerable to corrections and bear markets because asset values can fall while debts values remain the same.
More debt is not always a bad thing. Unfortunately, according to the BoC, “debt has become more concentrated in the hands of more highly indebted younger households, who may have less capacity to cope financially with a job loss or an unexpected interest rate increase”. The next graph confirms that a large share of the increase in household debt is attributable to highly indebted households under the age of 45.
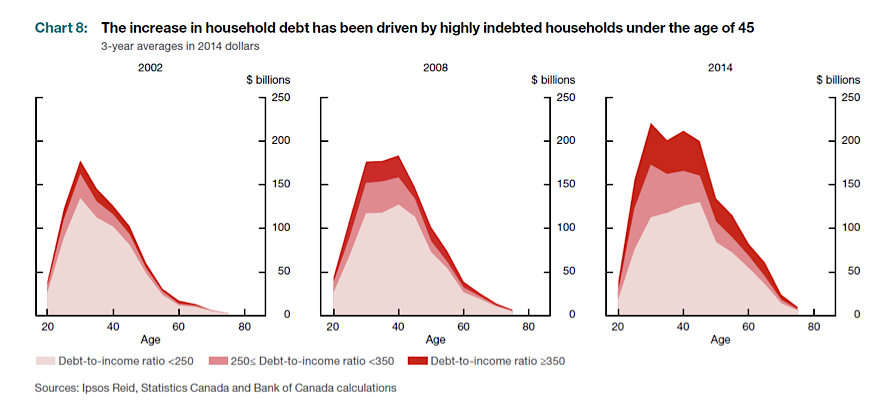
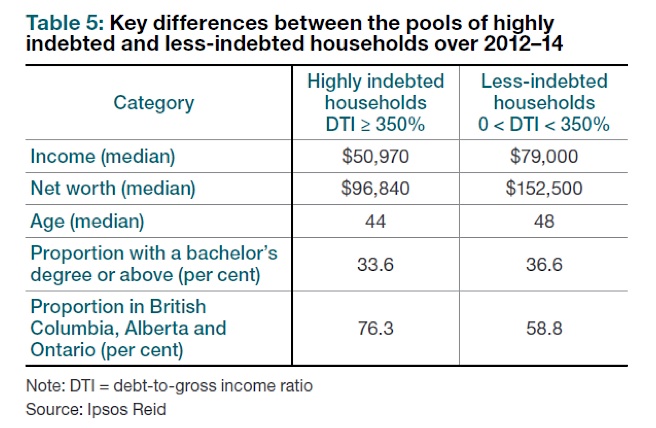
For the purposes of this report, highly indebted households are those whose debt-to-income ratios exceed 350% (or the pink and red segments in the previous image). These households held ~21% of all household debt from 2012-14. This is concerning because their financial positions tend to be relatively bad. The ensuing table demonstrates that highly indebted households:
1) Tend to have lower income and wealth,
2) Are younger,
3) Are less likely to have a bachelor’s degree and
4) Are more likely to live in BC, AB or ON.
These numbers are problematic because adverse economic events will reduce their ability to service their debts.
Canadian Housing Market Overheating
Debt and housing are inextricably linked, so it comes as no surprise that the BoC also highlights housing as an area of concern. Mortgages represented more than three-quarters of the increase in household debt from 2012-14. The circular issue for the Canadian housing market is that leverage is driving house prices, which necessitates more leverage. The danger is, of course, that falling house prices lead to rising defaults (and vice versa). In that case, collateral values would drop, resulting in losses not only for the homeowners, but also for lenders (principal) and mortgage insurers.
Nonetheless, the Canadian housing market is not homogeneous. For one, there is a trifurcation among 1) British Columbia and Ontario, 2) Alberta, Saskatchewan, and Newfoundland and Labrador and 3) The rest of Canada. The following diagram shows that resale activity and price growth have been much stronger in BC and ON than anywhere else.
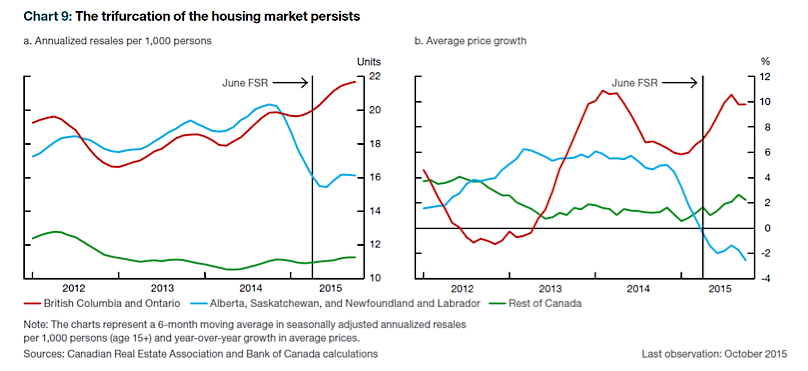
continue reading on the next page…

 Trading Near Top Of Price Range")


