The ‘Biden Bust’ that Trump warned us about has turned into the ‘Biden Boom’.
April 28th marked President Biden’s 100th day in office. In that time, the S&P 500 is up 8.6%. That mark’s the strongest stock market performance during a new president’s first 100 days since JFK in 1961.
Higher taxes you say? The markets do not seem to care. Focusing on April, equity markets continue to rise. In our home currency, the S&P 500 and Nasdaq saw +2.9% and +3.0% growth, respectively. The S&P/TSX is right there alongside them, posting a +2.7% month. Overseas, the Euro Stoxx 50 performed on par with North America, ending up +2.0% (CAD). These markets continue to roar as the road to recovery continues.
The positive performance in April has largely been driven by earnings surprises. At the time of writing, 301 companies in the S&P 500 have reported their earnings. 87% of those have reported actual earnings greater than analysts’ estimates. Looking at the past 60 quarters, this is approximately 12.5% greater than the quarterly average. A strong sign that companies are getting back to their pre-pandemic way of life.
One index our team is currently monitoring is the Bloomberg World Exchange Market Cap index. Put simply, it is the total global market cap of all public equities. Currently sitting at all-time highs of $113 Trillion (chart 1). The impressive velocity and linearity of this rally begs the question; Are we 30% economically better than we were pre-pandemic?
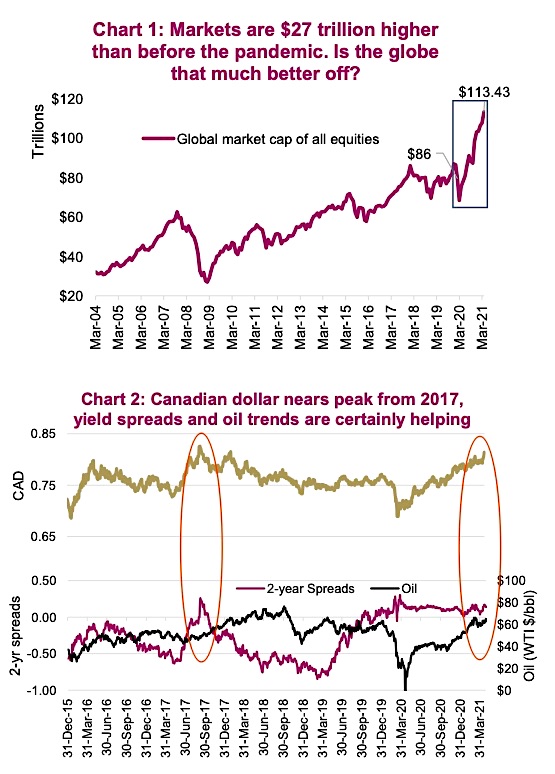
The BoC reduced their bond purchases in April causing some strength in the Canadian Dollar. The USD/CAD finished the month of April at ~1.23, which is the strongest the CAD has been since February 2018. The spread between the 2-year Canadian Government Bond (0.30%) and the 2 Year US Treasury yield (0.16%) continues to widen, meaning the shorter- term yield is more attractive in Canada for the time being. NYM WTI Crude continues its revival this month as well with a +7.5% month, finishing at US$63.58/bbl (chart 2). These two positive moves together have been boons for the Loonie.
Wouldn’t be a market recap these days without a little COVID-19 update. This month, I felt a little self-reflection would be appropriate. If you think our situation is bad here in Canada, Imagine multiplying our population by ~35 and reducing our landmass by two-thirds or 6 million km2. Now insert over 300,000 new cases of COVID-19 every day. That is the current dire situation in India. Seems unfathomable given our situation in Canada remains at 7,000 cases per day. Yes, the cases per population are similar, but imagine if you are packed in so tight that social distancing is not feasible. On top of the cases, low oxygen supply and stadiums filled with cardboard hospital beds are amplifying the situation.
The moral of the story is things could be a lot worse. However, India is not alone, other countries such as Turkey and Japan are also dealing with another reeling wave. Forgive me, but I, along with many others, have lost track of what number of wave we are currently enduring.
As investors continue their search for diversification or inflation hedges, many are challenged with traditional markets. An alternative to this conundrum is, you guessed it – real assets. Whether it be commodities, real estate, infrastructure or inflation linked securities, our team has prepared a deep dive into the various buckets to help alleviate the burden of navigating these non-traditional solutions.
Source: Charts are sourced to Bloomberg L.P. and Richardson Wealth unless otherwise noted.
Twitter: @ConnectedWealth
Any opinions expressed herein are solely those of the authors, and do not in any way represent the views or opinions of any other person or entity.
: Creating Bullish Divergence?")


 and Semiconductors (SMH): Concerning Price Pattern?")


