 In the right circumstances, U.S. stocks have room to rally – at least in the near-term. After the recent market pullback, U.S.-based stock funds attracted $14.1 billion in the week ended July 8 – biggest inflows since mid-December (courtesy of Lipper).
Funds specializing in U.S. stocks drew $12.6 billion. The SPDR S&P 500 ETF (SPY), attracted $6.7 billion – its biggest week this year. Bulls sure hope this continues. In addition, major U.S. stock market indices remain oversold (near-term) heading into Monday’s session. Last but not the least, the second-quarter earnings season begins in earnest this week – where the bar is low.

Should Greece cooperate, odds are in bulls’ favor. This is not the outcome non-commercial futures traders are hoping for. They are positioned to benefit from an opposite scenario. Last week, they raised net shorts in S&P 500 e-mini futures to 180,464 contracts – the highest since June 2012 (Chart 1 above). Nonetheless, this is also something equity bulls can use to their advantage. A rally here can potentially force these traders to unwind their holdings.
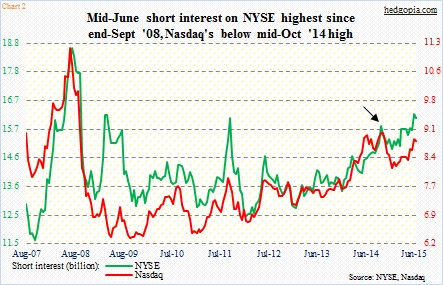
A similar potential tailwind awaits in the form of short interest. At the end of June, NYSE short interest fell 0.9 percent from the prior period, but mid-June was the highest since end-September 2008 (Chart 2 above). The mood is not uniformly bearish across indices or sectors or industries. On the Nasdaq, short interest remains below the mid-October 2014 level.
In U.S. stocks, the last major pullback took place during September-October last year. The S&P 500 Index came a hair’s breadth away from losing 10 percent, before bottoming in the middle of October and rallying strongly, as did other indices. That low therefore is a good reference point for comparison purposes.
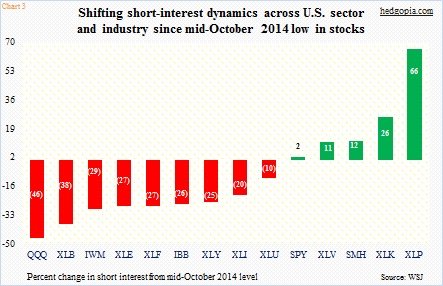
Chart 3 (above) compares current short interest on various sectors/industries with what it was when stocks bottomed mid-October last year. Back then, the subsequent rally squeezed the heck out of shorts. Short interest declined on both the NYSE and Nasdaq (arrow in Chart 2), acting as a tailwind for the rally that followed.
Do we have the same ingredients in place currently? While this looks to be the case at first glance – particularly considering the elevated level of short interest on the NYSE – a deeper look reveals a slightly different picture. Of the 13 sectors/industries in Chart 3, nine have short interest smaller now versus in the middle of October last year – including the PowerShares QQQ ETF (QQQ), and the iShares Russell 2000 ETF (IWM).

This tells us one thing. On these ETFs, the potential for a squeeze the like of which we saw last October is substantially less versus back then. Even on SPY, short interest is essentially unchanged now versus then – 298 million versus 292 million; it has not gone up despite a 15-percent rally since then. With that said, at least on SPY, it then dropped to 218 million in the next three months. Bulls sure hope a repeat of that. But can they deliver?
Thanks for reading!
Twitter: @hedgopia
No position in any of the mentioned securities at the time of publication. Any opinions expressed herein are solely those of the author, and do not in any way represent the views or opinions of any other person or entity.
: Creating Bullish Divergence?")


 and Semiconductors (SMH): Concerning Price Pattern?")


