After the FOMC minutes were released on Wednesday, the stock market responded with a sharp selloff.
The Federal Reserve’s underestimation of rising inflation pushed them to consider scheduling rate increases in 2023.
While 2023 is still far in the future, the stock market responded with choppy price action. This could be taken multiple ways.
The market could have been disappointed that it now knows when interest rates will increase and had hoped rates would stay low indefinitely.
Another potential reason is that the Federal Reserve does not seem to have a pulse on how quickly inflation is moving higher and does not look well equipped to deal with it.
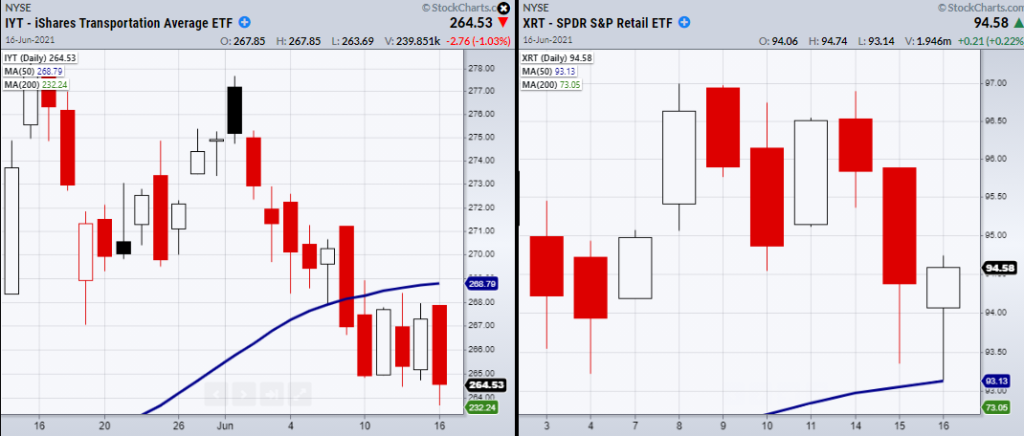
From a technical standpoint, if we look at Mish’s Economic Modern Family of ETFs, we can see that the small-cap Russell 2000 ETF (IWM) closed almost flat on the day, while the Retail Sector ETF (XRT) was able to hold over its pivotal 50-Day moving average at $93.13.
Furthermore, other ETFs including Biotech (IBB), Semiconductors (SMH), and Transportation (IYT) closed down on the day.

IYT has been especially important to watch as it could be showing further weakness in the demand side of the economy if it continues to break lower.
On the other hand, regional banking (KRE) rose on the Feds news of interest rate hikes.
What does this mean going forward?
Because the market has recently visited highs in the other major indices, we should look for the Family to hold its current range if we expect to move up further.
Especially IWM, which did not break to new all-time highs and has now drifted lower making its resistance level at $234.53 appear even stronger.
Because transportation is interlinked with retail space via direct supply and demand, XRT offers the best support to get IYT back over its 50-DMA at $269.14.
However, if we see all three begin to sell-off. Watch for IWM and XRT to make a phase change under their 50-DMA as a warning signal.
To see updated media clips, click here: https://marketgauge.com/media-highlights-mish/
Stock Market ETFs & Analysis Summary:
S&P 500 (SPY) 10-DMA 422.74 pivotal.
Russell 2000 (IWM) Doji day. 230.95 needs to clear and hold.
Dow (DIA) Watching for a second close under the 50-DMA at 341.97.
Nasdaq (QQQ) 342.80 pivotal area.
KRE (Regional Banks) 68.96 needs to hold.
SMH (Semiconductors) 245.19 support. 258.59 resistance.
IYT (Transportation) 264.70 pivotal area. 268.85 resistance.
IBB (Biotechnology) 154 next support.
XRT (Retail) Main support the 50-DMA 93.05
Twitter: @marketminute
The author may have a position in mentioned securities at the time of publication. Any opinions expressed herein are solely those of the author and do not represent the views or opinions of any other person or entity.


