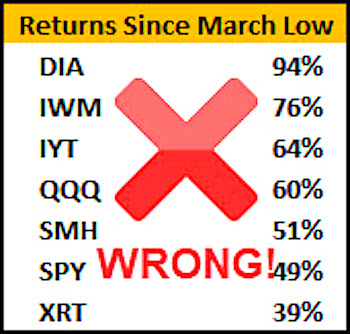
I’ve got a fun quiz for you today, and the answer may surprise you, as markets often do.
The challenge is simple. The symbols in the image above are not in the correct order of the returns listed.
Without looking at the end of this article, draw a line connecting the symbols to their correct returns since their lows in March.
Or reorder the symbols.
Before you look for the answer, here’s why the answer is important…
Yesterday’s article highlighted the acceleration of the rotational trend whereby the ‘leading’ mega-cap techs pullback as areas of the market that are commonly referred to as the ‘laggards’ begin to rally and ‘catch up’.
For example, the small-caps Russell 2000 Index ETF (IWM) has had a strong breakout above its 200 DMA as the large-caps Nasdaq 100 ETF (QQQ) has pulled back (ever so slightly) from its all-time highs.
This rotational trend continued today with the IWM and Transports (IYT) outperforming again.
The big winners today were the cyclicals.
Is the economy getting better?
Even long bonds (TLT) sold off, which can be indicative of improving economic conditions.
Do these lagging areas of the market have what it takes to lead the market higher and let the mega-cap techs rest or correct?
The short answer is yes.
It is possible for the mega-cap techs to rest, or even correct and have these other areas of the market remain strong.
The complexion of the bull market will change, but it can continue.
Yes, the expectations of improving economic conditions will have to continue for this to play out, but rather than worry about figuring that out…
Watch the leaders.
And how do you judge who’s leading?
It’s often a matter of perspective.
It’s not always the stocks at new highs.
I realize that this is a little bit of an oversimplification of how to judge a leading sector or index, but when you put the symbols in the image in the correct order (as they are in the image below)…
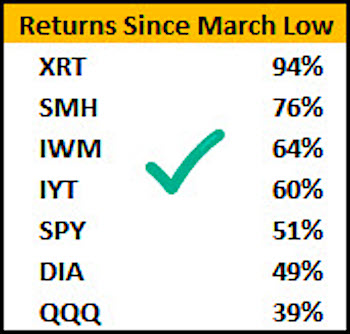
These ‘laggards’ have got some momentum and leadership qualities that many traders may have missed.
Notice I don’t have the lagging banks KRE on this list.
S&P 500 (SPY) New all-time high, 330 important support
Russell 2000 (IWM) Strong move up, 160 resistance area. 153 key support
Dow (DIA) New swing high, 270 now pivotal support
Nasdaq (QQQ) Three-day correction sitting on 10 DMA
TLT (iShares 20+ Year Treasuries) 170 area is pivotal and now clearly below it. First time it’s closed and continued under the 10-DMA since the June low. 169 is important support. Weakness below 169 may accelerate.
Twitter: @marketminute
The author may have a position in the mentioned securities at the time of publication. Any opinions expressed herein are solely those of the author, and do not in any way represent the views or opinions of any other person or entity.


: Creating Bullish Divergence?")

