Gold Mining stocks have been badly beaten in 2013. Taking the Gold Miners ETF (GDX) as a proxy, the sector is down over 55% as of yesterday. That said, the Gold Miners ETF is hanging around near term support and trying to hold on to a weakening RSI divergence. In short, if the Gold Miners are going to rally, it had better come soon.
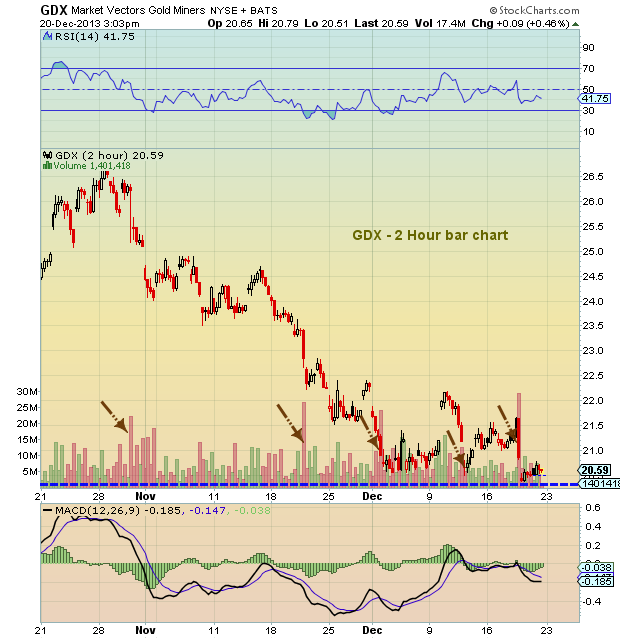
Looking at the near-term chart of GDX (see below), it’s apparent that $20.00-$20.50 is important support. Looking at the arrows pointing to the large “down” volume bars over the past two months, it’s worth noting that the 3 recent large volume bars have brought the Gold Miners down to near-term support, but failed to break it. This support area will be important to watch heading into year end.
GDX Near-Term Chart – Gold Miners ETF
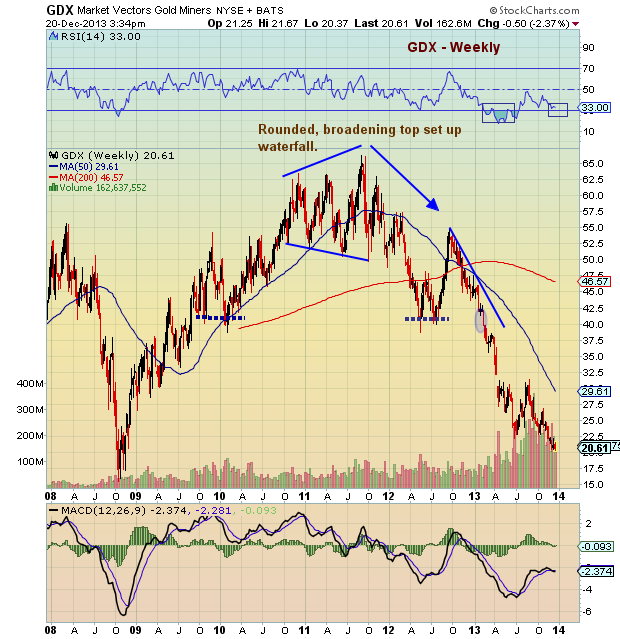
Zooming out a bit to a macro view, it’s important to note that should the $20 support fail to hold, the next macro support level for the Gold Miners ETF is at the 2008 lows ($15.83). Note the RSI divergence showing up with price at new lows, yet RSI “trying” to put in a higher low. This is tentative, but worth watching should GDX set up for a tradeable bounce.
GDX Weekly Chart – Gold Miners ETF
Also check out my recent post on 4 Gold Charts to Watch Into 2014. Thanks for reading. Trade safe.
Twitter: @andrewnyquist
No positions in any mentioned securities at the time of publication. Any opinions expressed herein are solely those of the author, and do not in any way represent the views or opinions of any other person or entity.
: Worrisome to Broader Market?")

: Important Breakout Retest")
