The emerging markets were the place to be for investors in the early 2000’s. BRIC (Brazil, Russia, India, China) was all the rage and investors desire to include exposure to these countries lead to a strong performance for emerging markets.
That is, until the 2008 financial crisis. At that point, things turned messy. And the Emerging Markets ETF (EEM) spent more than a decade underperforming the S&P 500.
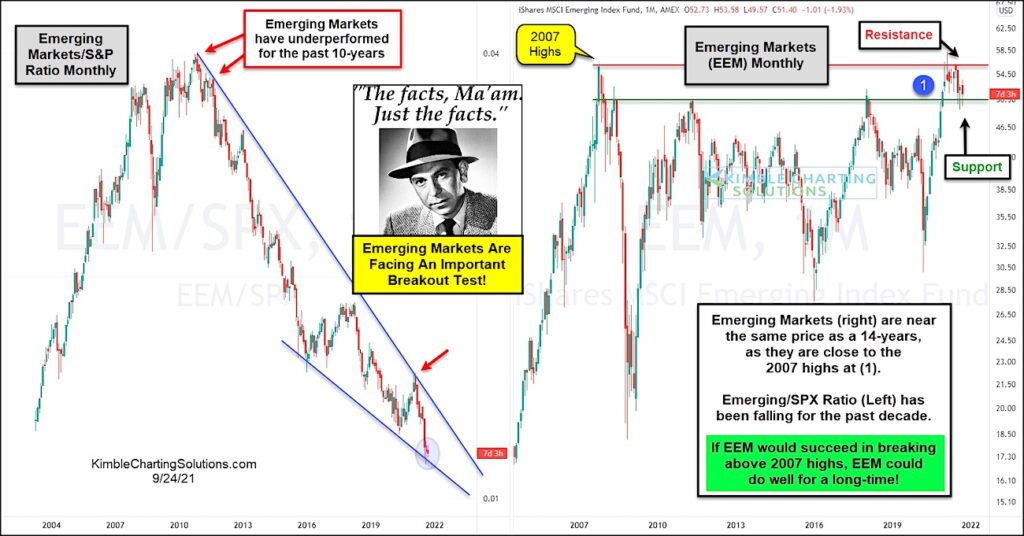
Today’s chart 2-pack highlights this and more. Below are “monthly” charts highlighting the Emerging Markets ETF (EEM) performance on the right, along with its relative performance versus the S&P 500 on the left.
As you can see, EEM’s performance versus the S&P 500 has been in decline for the past 10 years. And EEM finally tested its 2007 high earlier this year at (1), meaning its near the same price as it was at 14 years ago!
But not all is lost… Joe Friday says EEM facing important breakout test!
If the Emerging Markets ETF (EEM) can succeed in breaking out above the 2007 highs, EEM would likely get back on track and begin to win over investors once more.
So keep an eye on those 2007 highs… and stay tuned!
Emerging Markets versus S&P 500 + Emerging Markets “Monthly” Charts
Note that KimbleCharting is offering a 2 week Free trial to See It Market readers. Just send me an email to services@kimblechartingsolutions.com for details to get set up.
Twitter: @KimbleCharting
Any opinions expressed herein are solely those of the author, and do not in any way represent the views or opinions of any other person or entity.


