If you’re trading the stock market indices with daily or intraday charts, the past few months have presented a lot of opportunities to fade the spikes in both directions.
However, the indices have been finding it difficult to crush nearby supports in the way bigger-picture bears would like.
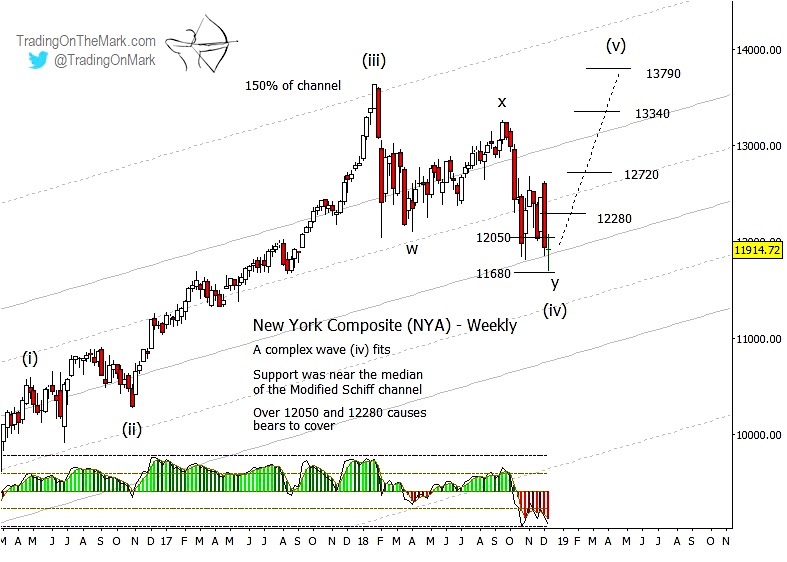
The NYSE Composite (INDEXNYSEGIS: NYA) test of a big 1×1 support level earlier this week at 11680 is exactly the kind of fade opportunity that contrarian traders watch for. A quick reaction was almost guaranteed, and a more extended rise is possible.
That would make the next year very interesting! By the way, we are offering a special subscription package for traders who want to stay on top of things in 2019.
The price bars of recent weeks still look like part of the corrective pattern we highlighted in our October 18 post at See It Market.
Some of the reasons we favor the bullish view are outlined below:
– Channel support and a larger 1×1 measurement at 11680 make the current area an attractive candidate for an upward reversal that would look like the conclusion of a fourth wave in hindsight (or in the present, if you’re using the chart below).
– There really wasn’t a prominent fourth wave during the rally leading up to the late-2017 high. Normally we would expect that kind of “stutter step” emotional pause before the market reaches an ultimate high. The action of the past year probably represents the fourth-wave stutter step.
As a bearish contingency, traders should be prepared to take advantage of a strong break of the 1×1 support followed by a retest of a Fibonacci or geometric support area from below. However it is risky to sit in a long-term bearish position while still on top of the support.
If the 1×1 support holds, the next challenge for bulls will be to recover the support mentioned earlier at 12280. Above that, larger measurements come into play related to wave (i) which ended in 2016. In that scenario, bulls would watch NYA 12720, 13340 and 13790 as potential resistance, and we would expect to see at least a modest new high sometime in 2019. From where the market sits right now though, the rally would be anything but modest!
One of our most popular offers in recent years has been to add three months of free charts and analysis to a 9-month subscription. We’re making that offer available again during the holidays in preparation for another year of volatility (with some nice trending moves too). Lock in 25% savings on 12 months of our Daily Analysis service or our Intraday Analysis — just use the code “reindeer” when you sign up at our website.
Happy holidays to you from Tom and Kurt at Trading On The Mark!
Twitter: @TradingOnMark
The authors may have a position in the mentioned securities at the time of publication. Any opinions expressed herein are solely those of the author, and do not in any way represent the views or opinions of any other person or entity.


 Ready To Break Out?")

