When we wrote about the British Pound ETF in September, we were treating the developing pattern as a downward impulsive wave coming out of what had been a sharp wave upward correction that peaked in April 2018.
Specifically we suggested a bounce was imminent from support at 116.84. in the CurrencyShares British Pound Sterling Trust (NYSEARCA: FXB).
The bounce took place as expected, and anyone who attempted a bullish countertrend trade from there probably walked away with profits.
The problem is the bounce didn’t stop where we thought it would, and that has forced us to revise our Elliott wave count.
The chart below shows how the revised count applies to British Pound futures. The support that produced the recent bounce from 1.2006 in the Pound corresponds to the FXB support we described in September at 116.84.
The strength of the rally since September, and particularly during the past two weeks does not fit well with expectations of a downward impulse. The most likely scenario now is that corrective wave [iv] was more complex than we assumed earlier, and that the rally during the past three months represents wave (c) of [iv].
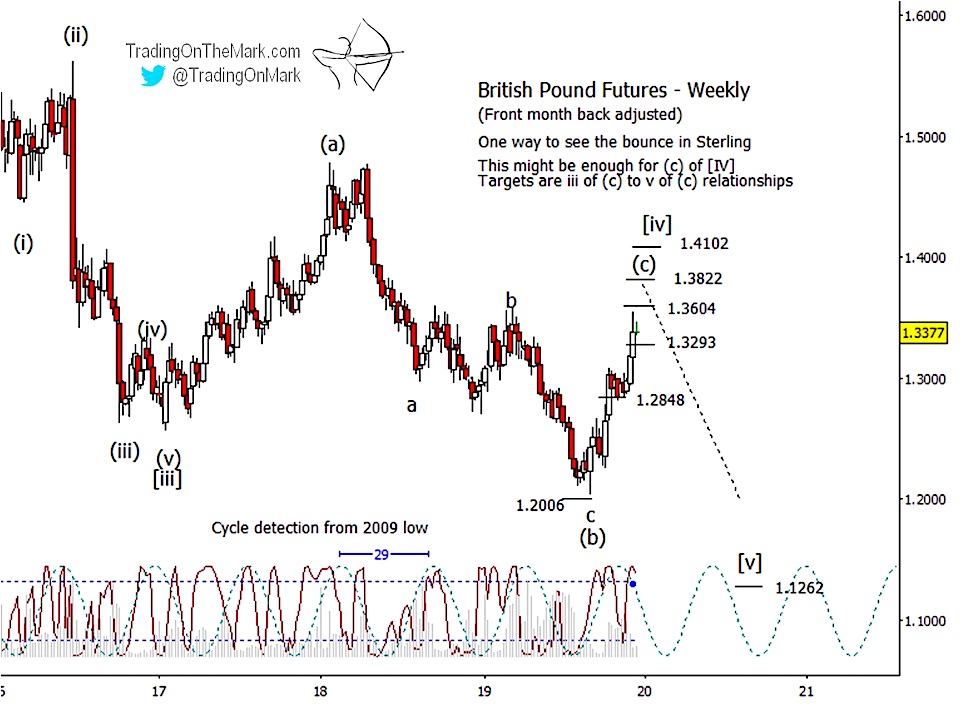
The ‘C’ wave during a three-part correction is usually impulsive, meaning it consists of five sub-waves and is a fairly strong move. Treating the recent rally as wave (c) of [iv], it appears that sub-waves ‘i’, ‘ii’, ‘iii’, and ‘iv’ may already be in place.
Price may now be trying to top out with the final wave ‘v’ of (c) of [iv], which would precede a downward reversal. (The price spike after the U.K. parliamentary election has the feel of a move based on event-driven sentiment – the type of development more experienced traders prefer to fade.)
Based on standard Fibonacci relationships among the sub-waves inside (c), likely resistance targets in the near future include 1.3604, 1.3822 and 1.4102. Any of those areas is a reasonable place to watch for the expected downward reversal.
A very preliminary target for downward wave [v] coming out of the corrective pattern is 1.1262.
Note that two of our timing tools suggest the price spike may be short-lived. The 29-week price cycle has shifted into its downward phase, while the more rapidly responsive Lomb periodogram has peaked.
It’s easier to find the trades when you start with the right charts. Right now you can get access to all the charts and lock in a deep 20% price reduction with the coupon code YULE.
Visit Trading On The Mark to see examples of our coverage of the Euro, the Dollar Index, gold, crude oil, bonds and the S&P 500 on weekly, daily and intraday time frames. We’re also rolling out a new feature that lets subscribers receive charts and posts by email.
Twitter: @TradingOnMark
The authors may have a position in the mentioned securities at the time of publication. Any opinions expressed herein are solely those of the author, and do not in any way represent the views or opinions of any other person or entity.

 Flirting With Critical Support… Again")


