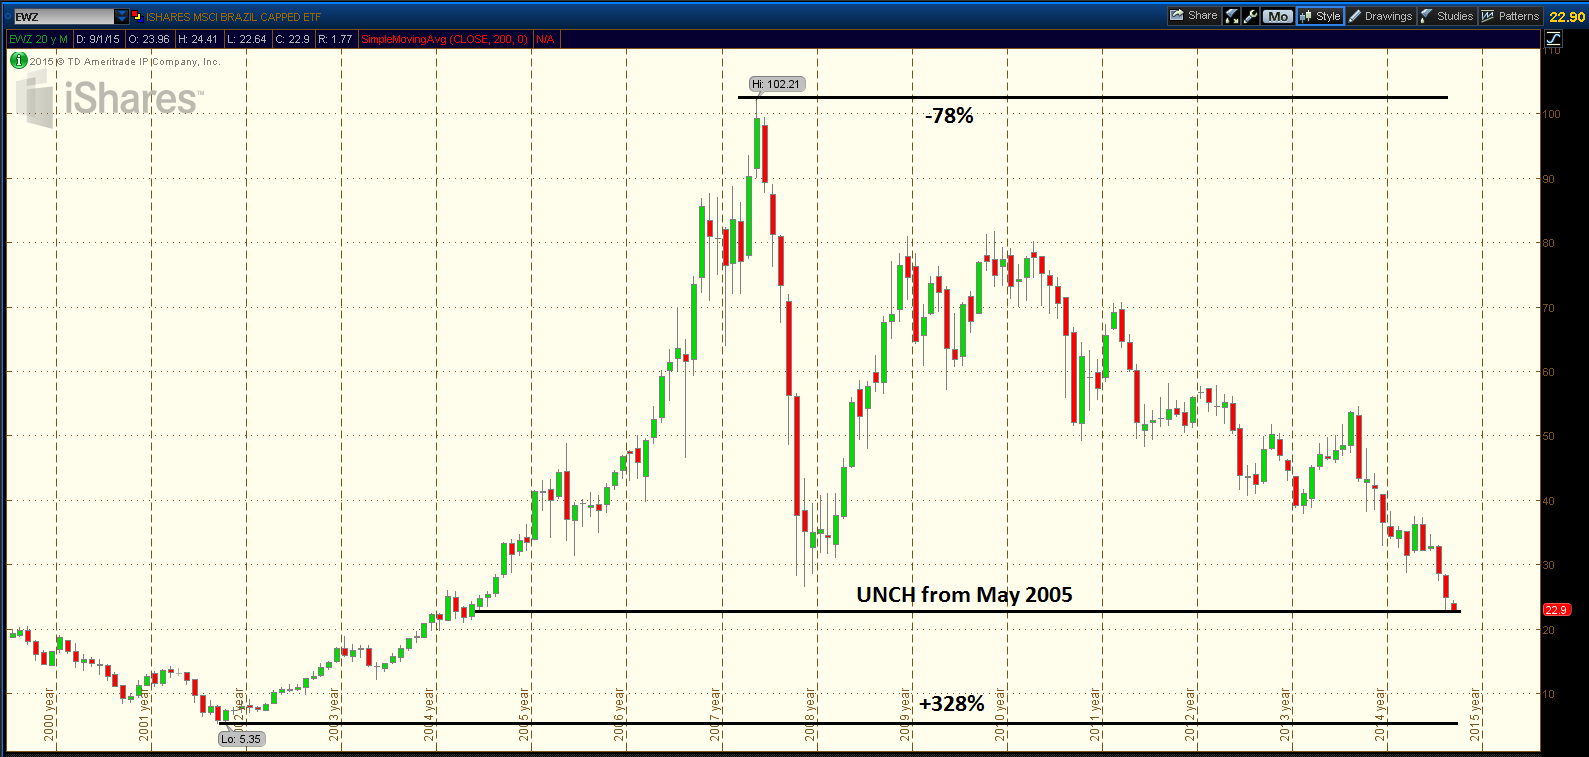
Once among the hottest emerging markets plays of the mid-2000’s, the Brazil stock market has endured a multi-year collapse. The iShares Brazil ETF (EWZ) has fallen nearly 80% from its all-time high in May 2008.
What’s perhaps just as astounding, the epic bull market that took place from 2002-2008 brought EWZ from about $5 per share to over $100. In short, an investor would still be up about 300% if he or she bought in near the lows in 2002.
Up 300% in 13 years while also down 78% in 7 years – that’s what I would call volatility! EWZ would have to climb 346% to reach the all-time high from its current level. It managed to do that in only 36 months from May 2005-May 2008 – that was a compounded average monthly growth rate of 4.2%.
Check out the long-term chart of the ishares Brazil ETF (EWZ) below. click charts to enlarge
iShares MSCI Brazil Capped ETF (EWZ) – 15 Year Chart
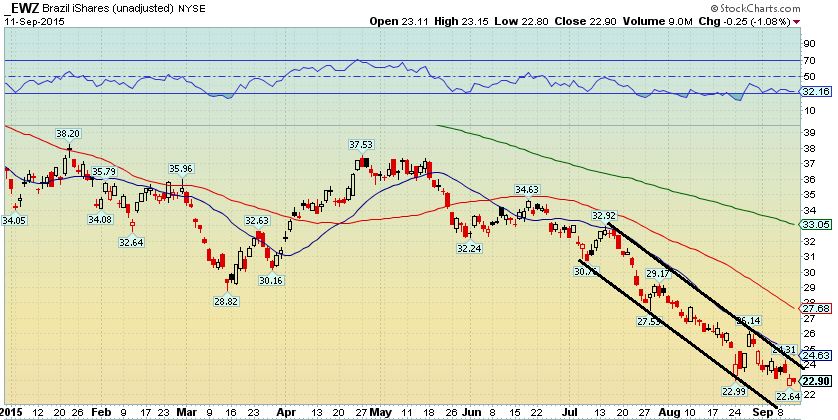
Turning more near term, you can see the clear downside price action on the year-to-date chart. Looking for a long setup here is the essence of the cliché, “catching a falling knife”. At the very least, a trader would be advised to wait for this downtrend channel to be broken to the upside before entering a speculative long position.
EWZ 2015 year-to-date Chart
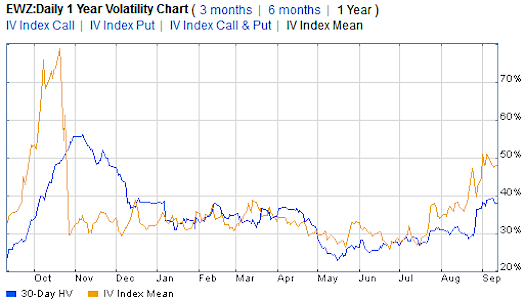
A trader needs to also pay attention to the risk management side of the trade, not just how the price and volume look on the chart. One can do this by analyzing the implied volatility of EWZ.
The implied volatility of the Brazil ETF is near 52-week highs. You will notice the sharp spike in volatility that took place about one year ago around the Brazil elections. The implied volatility index mean, which is a figure determined by the options premiums on EWZ, rests near 50%. A 50% IV means the market expects EWZ to swing 14-15% over the next month. For perspective, the S&P 500 IV (aka “the VIX”) has not been this high since March 2009 (except for the initial print on morning of the most recent flash crash event). The trader should weigh the expected volatility in EWZ before entering a position.
Brazil ETF – EWZ implied volatility
Thanks for reading.
Twitter: @MikeZaccardi
No position in any of the mentioned securities at the time of publication. Any opinions expressed herein are solely those of the author, and do not in any way represent the views or opinions of any other person or entity.


