Boeing (BA) has been a major bull market momentum leader for the Dow Jones Industrial Average.
As you can see in the chart, it rocketed higher throughout 2016 and 2017, leading the Dow Jones Industrials to all-time highs early this year (in January).
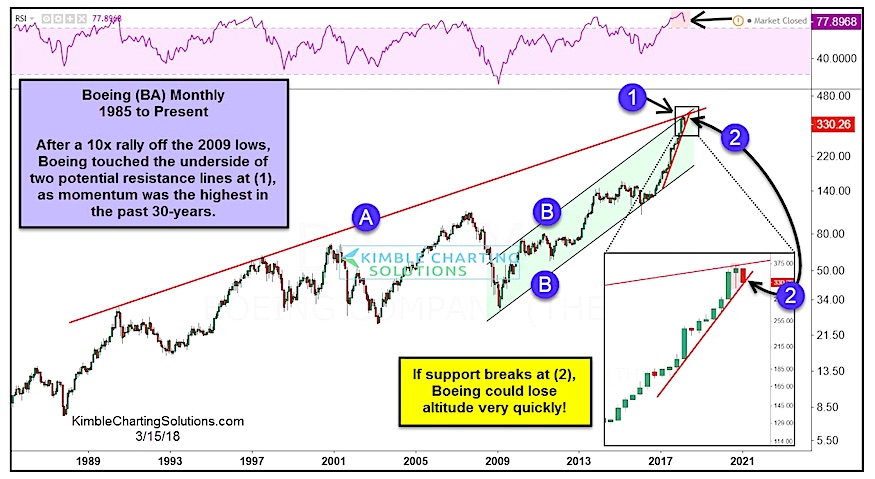
But as the Dow Industrials was hitting major Fibonacci resistance, and putting in “monthly” doji candlesticks… so was Boeing’s stock! Is a Boeing stock reversal in the works?
Whenever a fellow leader beginning to show weakness, it’s worth putting on your radar. Could Boeing pull the broad index lower?
Looking at the chart, you can see the monthly Doji candlestick and quick move lower. Boeing’s monthly RSI (momentum) hit its highest level in 20+ years.
While Boeing’s stock reversal has yet to break through it’s up-trend line, it is currently testing it and needs to be monitored. Should this level give way, it could lead to more downside for the stock… and the Dow Jones Industrials.
So stay tuned!
Note that KimbleCharting is offering a 30 day Free trial to See It Market readers. Just send me an email to services@kimblechartingsolutions.com for details to get set up.
Twitter: @KimbleCharting
Any opinions expressed herein are solely those of the author, and do not in any way represent the views or opinions of any other person or entity.


