Are we really talking about a biotech sector breakout? Biotech stocks have been through a lot in the last 12 months…
The biotech sector as a whole lost almost half its value in an eight month period. A combination of factors led it down a path of extreme volatility and erratic trading from last July’s highs to the February lows. Many pundits blamed the political rhetoric of price gauging on drugs, but there’s likely more to it than that.
When a sector has a 500% run in 6 years (2009 to 2015), sometimes it simply needs a catalyst to bring on a much needed correction. The rocket ship was in need of a refueling stop and Hillary Clinton may just have provided it last year with her attack on drug companies’ controversial pricing policies.
Now that the electoral campaign attention has subsided, the sector seems to be ready to regain some footing. There is still some headline risk as the November election looms, though. And if the rhetoric were to pick back up it could still cause some headaches. That said, on a technical level, the rebound for the Biotech Sector (NASDAQ:IBB) could just be getting started.
Let’s take a look at some charts of 2 popular Biotech Sector ETFs (IBB and XBI).
Here’s the Biotech Sector breakout as seen on the IBB chart. The first thing that pops out is the biotech sector breakout over its primary downtrend line.
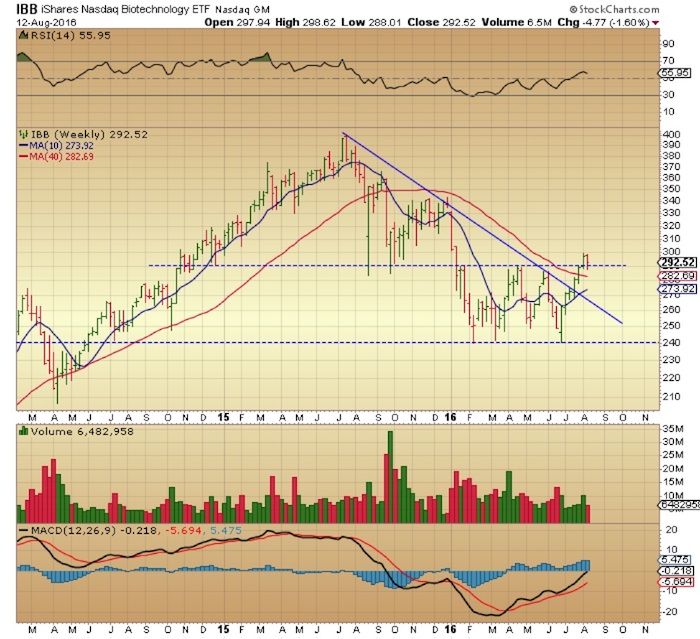
The weekly chart (above) of the iShares Nasdaq Biotechnology ETF (IBB), illustrates the big rally over the past handful of months. This follows a 40% decline from July 2015 to the February 2016 lows.
After the February trough, the sector went through a long and volatile consolidation between $240 and $290. That is, until last week’s breakout to YTD highs above that $290 supply band. The pullback this past week retested that area and after a brief dip below it, managed a close above it. This shows some resilience on the part of the bulls and the sector as a whole.
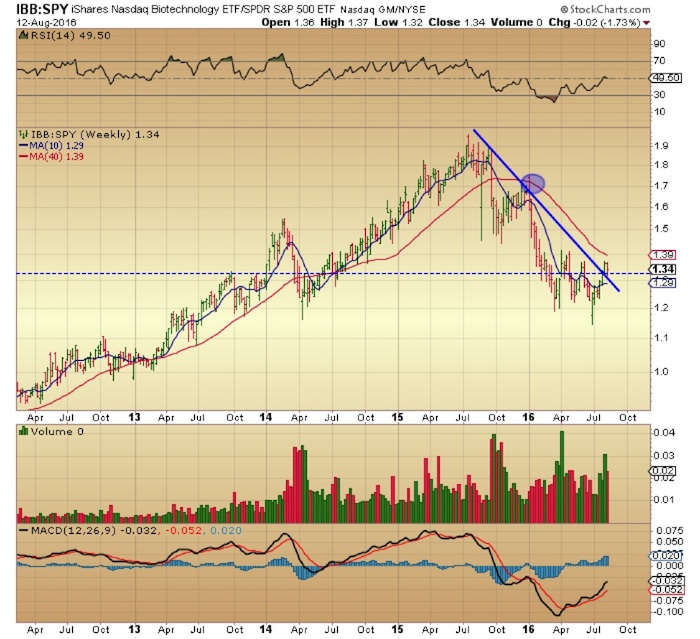
The weekly chart of IBB relative to S&P 500 (NYSEARCA:SPY) shows a steep, 12 month downtrend line that was finally broken last week (see chart above). In this case as well, the 1.7% pull back last week retested the downtrend line and held along with some structural support in that same area. Keep in mind that the biotech’s outperformance to SPY took place during a period in which the S&P 500 reached all time highs. That is certainly a healthy sign that the biotech sector breakout may lead to further outperformance.
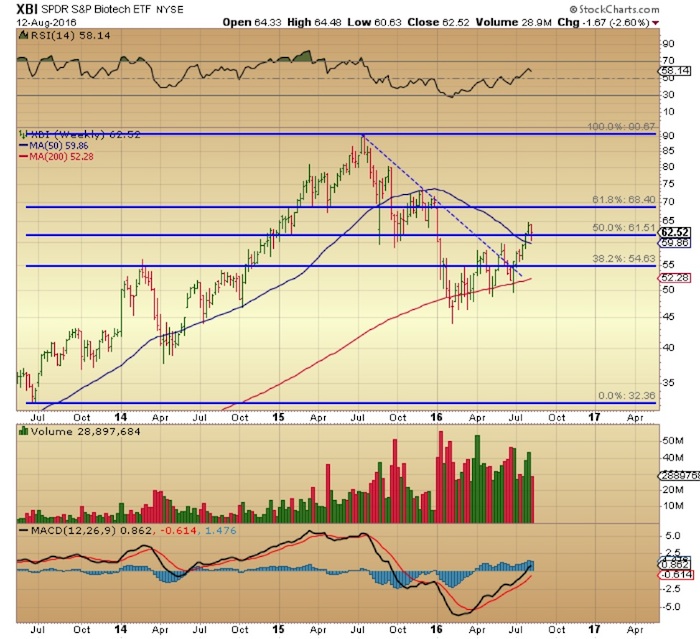
Taking a quick look at the SPDR S&P Biotech ETF (NYSEARCA:XBI) weekly chart (above) we see that some fibonacci levels come into play. The 2.6% pullback in XBI was more sustained than IBB’s, but XBI did manage to hold on to the 50% retrace of the 7/13 to 7/15 run! This is a constructive sign, especially if it can hold that level going forward.
There was no real technical damage on the chart from this past week’s action. We also have the 10 week moving average about to cross above the 40 week MA. It’s always a plus to have those moving averages stacked up in the proper order. The $61.50 level is the one to keep an eye on here for short term momentum.
Considering the deep pullback from last year, the sector still has plenty of room to the upside. Despite the 9% run in the last four weeks, the biotech rebound could just be getting started. Consider that there are some former momo names, like Gilead, that are currently trading with a P/E of 7!
Some consolidation here would certainly not be a bad thing as long as the technical levels hold and the political rhetoric doesn’t pick back up. That said, with indexes at all time highs, the market will have to do its part. A breakdown in broader market indexes would clearly not bode well for bios at this juncture. Although the broader market could use a rest here, it doesn’t mean that it needs to correct by any means, and for the moment, there are no clear signs of a breakdown on the horizon.
Thanks for reading.
Twitter: @DDCapitalFund
The author does not have a position in mentioned securities at the time of publication. Any opinions expressed herein are solely those of the author, and do not in any way represent the views or opinions of any other person or entity.
: Creating Bullish Divergence?")


 and Semiconductors (SMH): Concerning Price Pattern?")


