By definition, any trend that becomes so axiomatic for the market that not participating seems obscene has entered its latter days.
Three weeks ago we checked in on the largest stocks (by market cap) in the soaring Biotechnology industry, concluding that apprehensive observations voiced about an expanding bubble there may not just be more of the stereotypical wild-eyed permabear screed so routinely dispatched over the last 5 years.
The active market variables serving as the foundation of a Biotech bubble argument are varied and many: stratospheric price-to-sales ratios assuming near-vertical revenue growth curves, the “dash for trash” as smaller-capitalized companies multiply and the ravenous public appetite for IPOs already pricing dizzying valuations but then doubling (or tripling) within days of beginning to trade.
As a technician, I find these points harmonize well most of the Biotech stocks I’ve come across. So well, in fact, I noted on February 22 that there is a concerning absence of charts that aren’t parabolic:
The challenge and (ominous) commentary of these charts that dares to suggest a Biotech bubble is mounting is reverse scarcity: phrases like “hidden gems”, “diamonds in the rough” and “needle in the haystack” are useless here because charts featuring high triple and even quadruple digit gains over the last few years are everywhere – it’s the dross that is hidden away.
Since then, the reverse scarcity has abated slightly among the larger cap stocks (few can be called “large” – barely 4% of all Biotech stocks have a market cap over $10 Billion). However, the lack of diffusion among Biotech stocks – the lack of variation in their price action – is left undiminished, suggesting a careless homogeneity in the market’s conception of the industry that fundamentals company-to-company simply do not bear out. Though factors such as major advances in genomic research and FDA accelerated approval do add up to a rising tide, not all boats in the biotech space are equally seaworthy, even if their charts are equally staggering and the quasi-religious dedication of their speculative devotees equally fervid.
Naked speculation – like technical analysis – doesn’t question why, but is only concerned with where and when. Critically, however, naked speculation (quite unlike technical analysis) is too busy considering gains to care for risk protocols; and so the rug is pulled out from beneath those delighting in the all too human foible of animals spirits again and again. After so long, speculative feedback loops enter an irrevocable spin; and only after the irrational exuberance pushes sentiment off a cliff can something like heterogeneity and fairness in industry-wide valuations prevail.
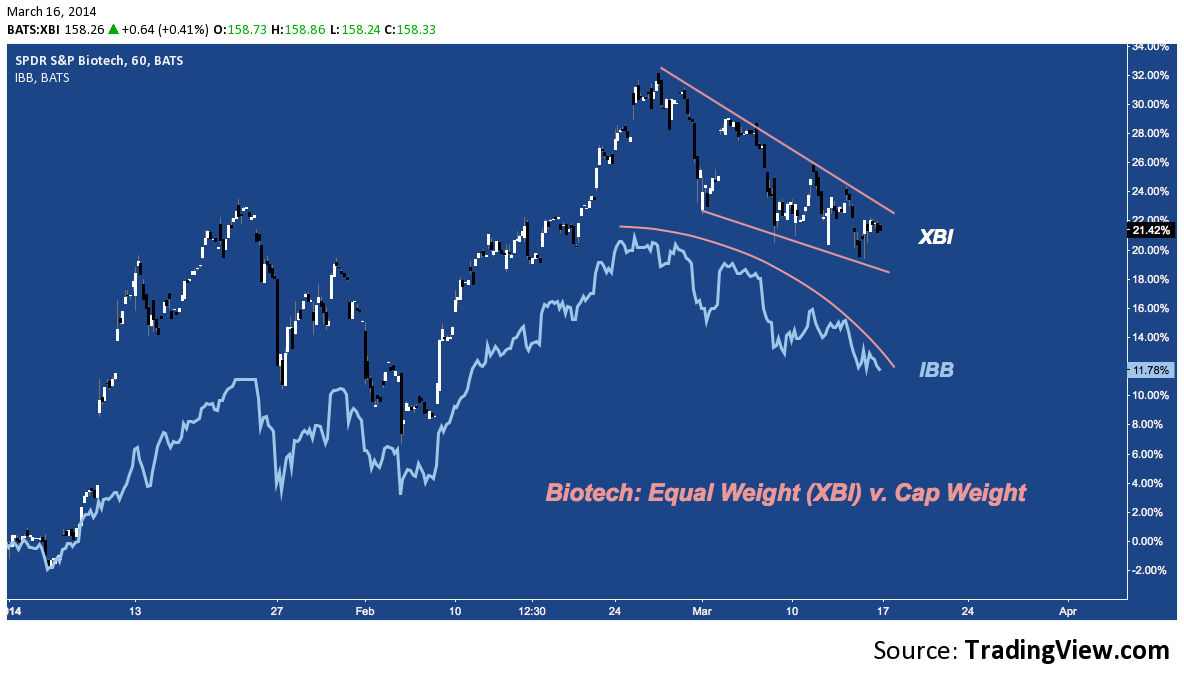
Even as Biotechs have faded modestly in the past few weeks, smaller issues have entered a season of relative strength. To wit, the equal-weight S&P Biotech ETF (XBI) is radically outperforming the cap-weighted iShares Biotech ETF (IBB). These ETFs don’t have identical constituents, true; and mid-cap Intercept Pharmaceutical’s (ICPT) 577% YTD performance is largely responsible for XBI‘s decoupling pop in early January.
But with XBI up nearly 2-to-1 versus IBB over the last 9 weeks, it’s clear the lower-priced and just-issued are capturing a lot of notice.
Biotech – 2014 YTD: Equal Weight (XBI) v. Cap Weight (IBB)
A few interesting statistics on this theme:
- 95 of the 208 (45.6%) listed Biotech stocks are Micro-cap/Nano-cap(<300M). This is only slightly higher than the overall Healthcare sector (43.8%); but far outweights Industrials (28.7%), Materials (25.4%), Utilities (13.6%), Financials (11.8%), Consumer Goods (32.1%) and even Technology (35.6%) generally.
- Of the Top 100 performing Biotechs YTD, 21 have a market cap >1B (i.e. middle small-cap); while 44 are micro-cap.
- Of the 208 listed US Biotechs, 39 (18.8%) public less than 1 year; 21 (10%) less than 6 months, 11 (5.2%) less than 3 months.
- $IBB is +11.81% YTD. 40% of all Biotech stocks are outperforming it by at least 2-to-1.
- Of 6795 listed stocks, 28 (.041%) are 100% or more above their 200-Day SMA. 11 of these – i.e. 40% – are Biotech/Big Pharma.
Before diving right into individual Biotech names, a top-down glance from the sector and industry level tells us the industry tone has changed in just a few weeks, reminding us that steep trends often take their time spooling up, but can unwind at a rapid rate.
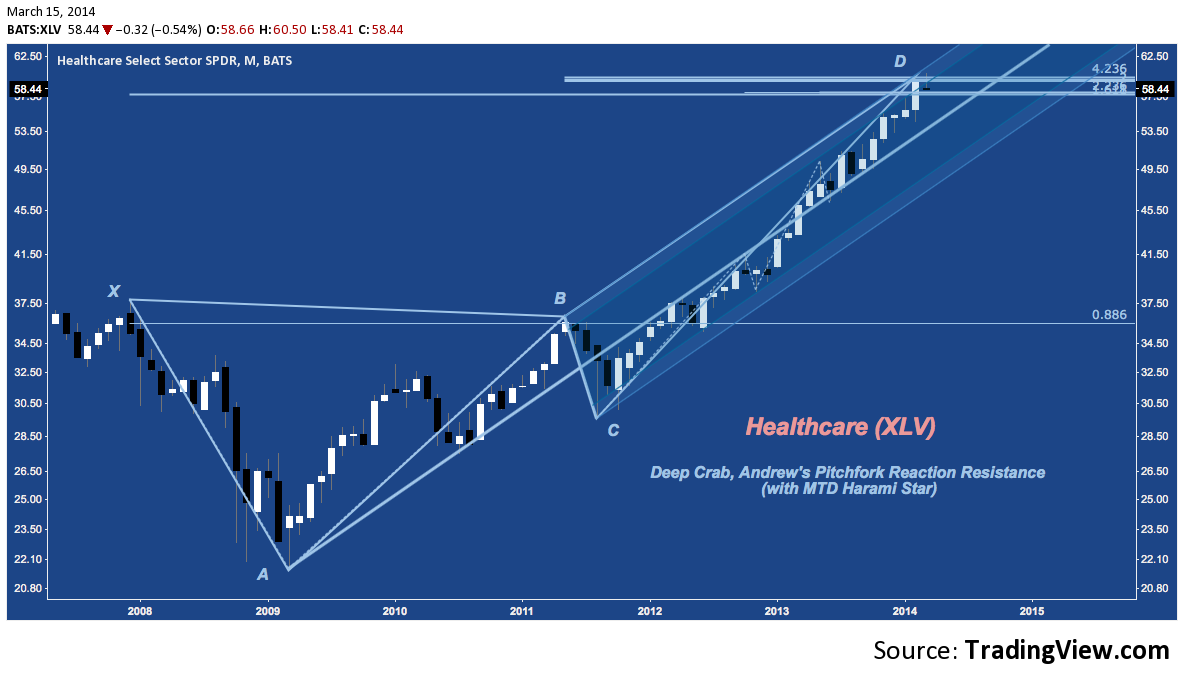
Healthcare (XLV) – Monthly: Cyclical Resistance
Much of Biotech (though not all) is situated in the Healthcare sector, (XLV) so it pays to be cognizant of how this segment of the S&P 500 (SPY) is faring. After steamrolling it’s peers last year (precisely because of Biotech) and having it’s best month in 6 in February, XLV is stalled at Deep Crab harmonic pattern resistance and Andrew’s Pitchfork upper reaction line resistance. Put another way, the structure of Healthcare’s rally off the 2009 lows suggests a lengthy consolidation or even major reversal is probable at this point in time and price. March’s candle month-to-date has created a harami star (similar to an inside month) that heightens the likelihood of a reversal if pressed over the next two weeks.
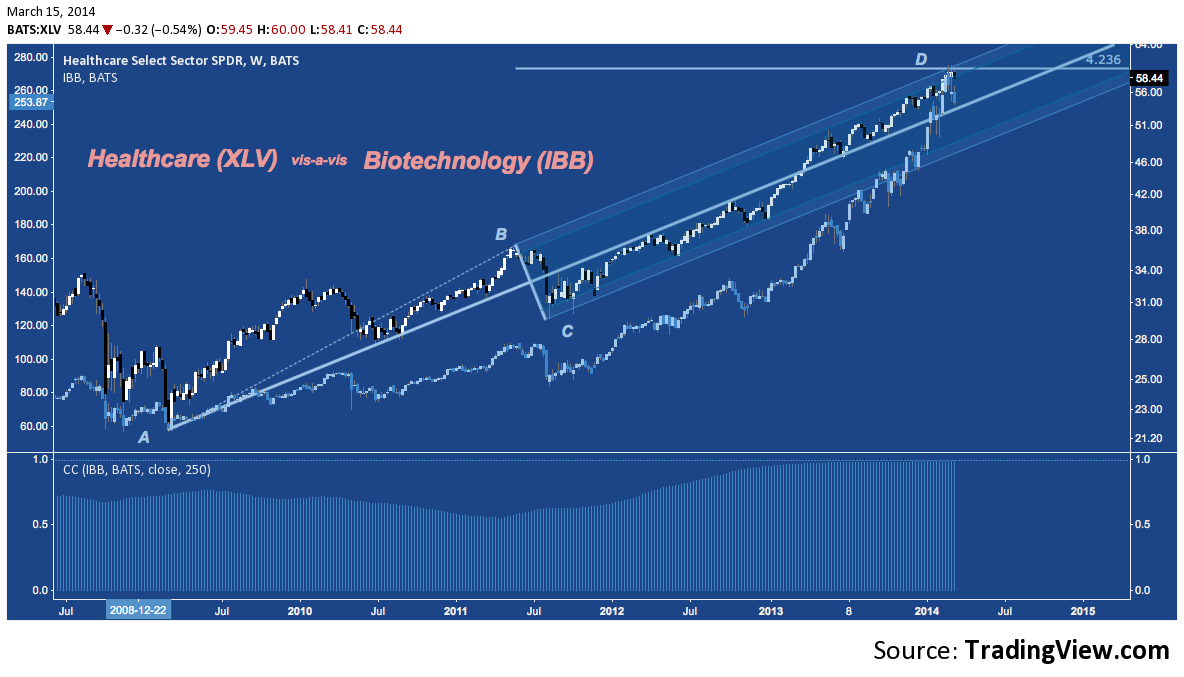
Healthcare and Biotech have always borne a significant positive correlation to one another; but that correlation has rise to a virtual identity with the current long-term correlation (5-year lookback, below) at .9912. It’s no exaggeration to claim IBB will dictate the headline performance of the Healthcare sector goes for the foreseeable future.
Healthcare (XLV) and Biotechnology (IBB): Perfectly Correlated
Has Biotech always been this way? The widely-held conception of Biotech plays as high-risk, high-reward is prevalent because a disproportionate number of stocks in the industry do produce “disruptive” drugs and therapeutic applications, turning their stocks into winning lotto tickets. Of course, many Biotechs flounder and flame out; but comparatively few of those are remembered, creating a dangerous survivorship bias that irrationally funnels speculative interest toward the industry.
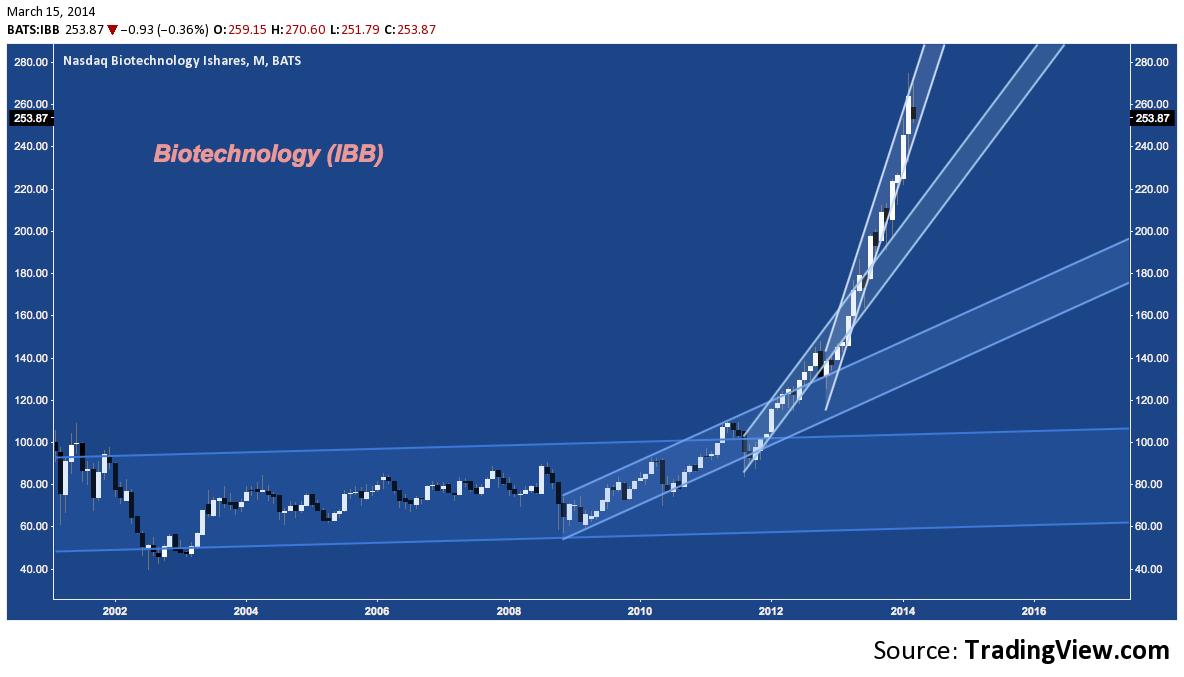
The Dot-Com period firmly established this tone; but after it’s 2001-2002 collapse and 2003’s swift-but-short-lived bullish mean reversion, Biotech as an industry entered a period of general dormancy until 2009. In late 2011, upward momentum ticked higher; and since mid-2012 a parabolic trend has carried IBB nearly 150% higher. You can follow the dendritic trend progression from almost-sideways to almost-vertical here:
Biotech (IBB) – Monthly: Launch Ramp
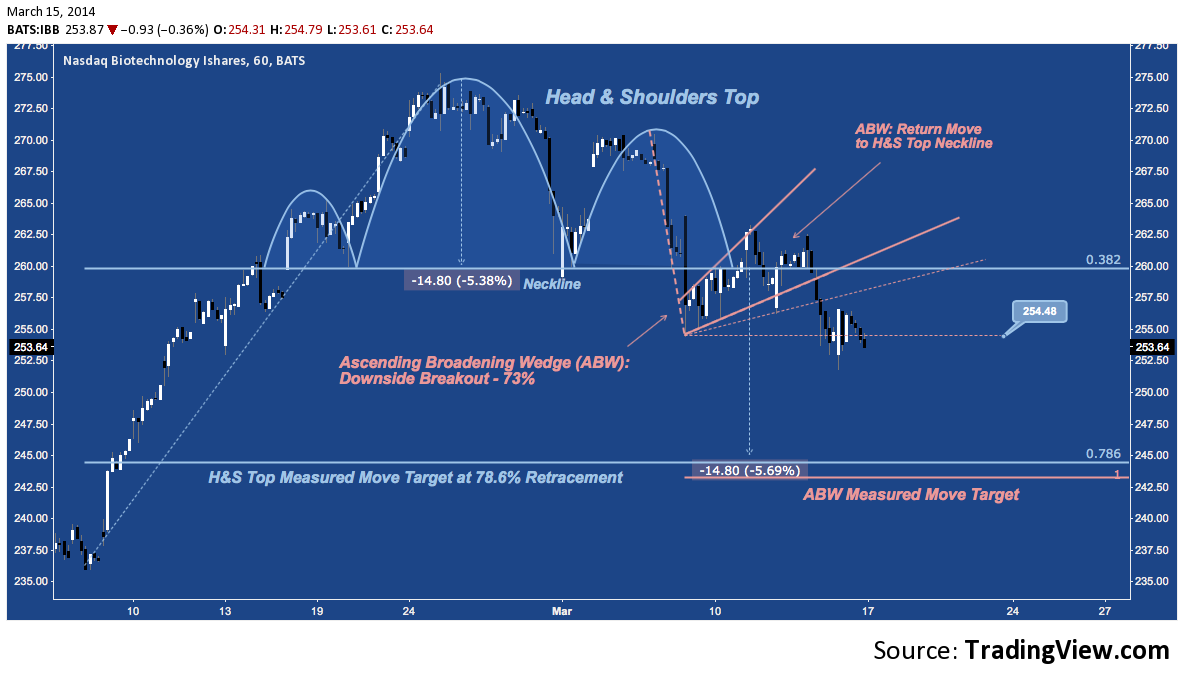
As mentioned, the last 3 weeks have been counter-trend, featuring the largest pullback (-8.57% peak-to-trough since the 02/25/14 high) since early October. A hard-fought Head & Shoulders Top has characterized the move down to-date and suggests there’s more to go:
Biotech (IBB) – Hourly: H&S Top
Turning to individual stocks, like last time we’ll concentrate on the fifteen largest by market cap in the industry (saving micro-cap and IPO biotech/pharma for a future post).
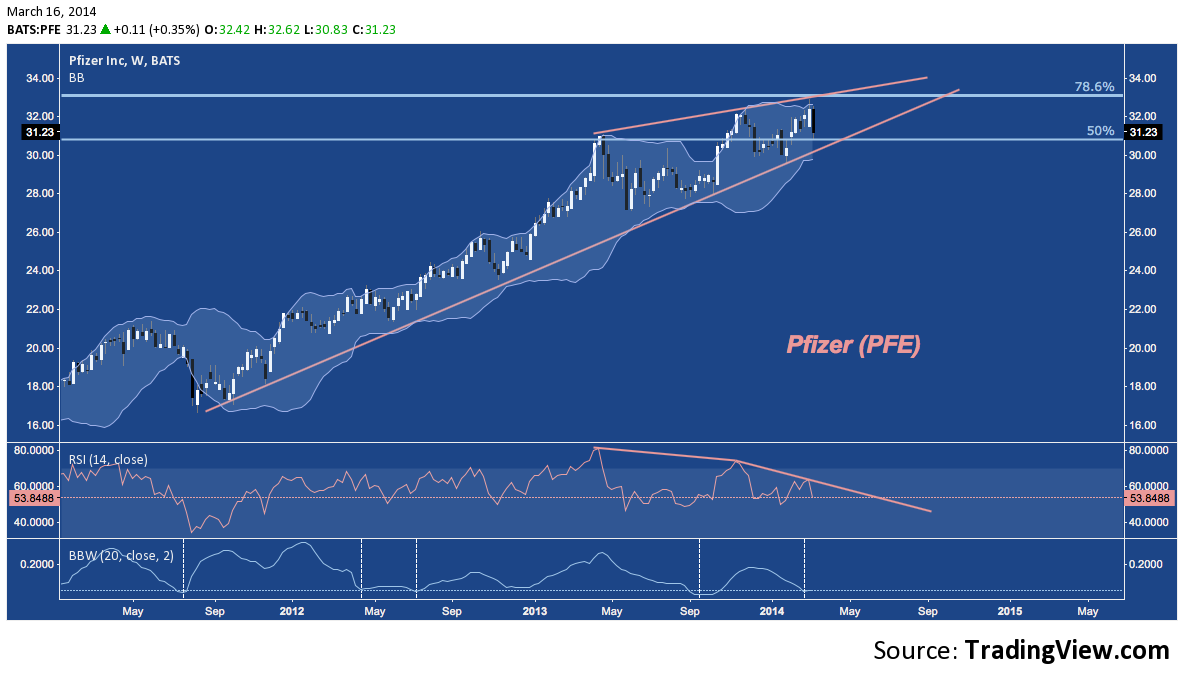
Pfizer (PFE) – Weekly: Rising Wedge, Low Volatility, Diverging Momentum
With a market cap of $213 Billion, Pfizer is a mature monstrosity among it’s Biotech peers. Over the past few months, the pace of PFE‘s upward progress has ground to glacial pace as it courses through a rising wedge at cluster resistance on negative momentum:
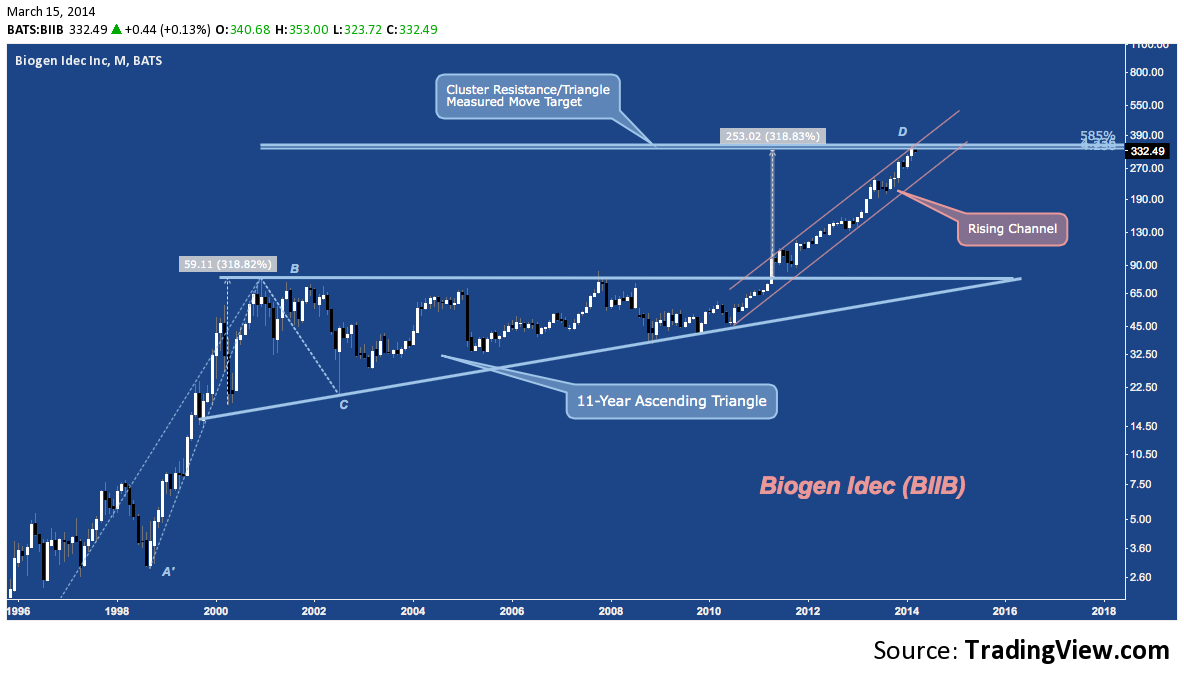
Biogen Idec (BIIB) – Monthly: Cluster and Measured Move Resistance
Biogen tagged the measured move target of it’s 11-year ascending triangle several weeks ago, coinciding with the top of it’s 4-year rising channel and at multi-decade structured resistance. A lateral consolidation across the channel throughout this year (“correcting by time”) is among its best-case scenarios with a double-digit decline from here to channel support a plausible alternative.
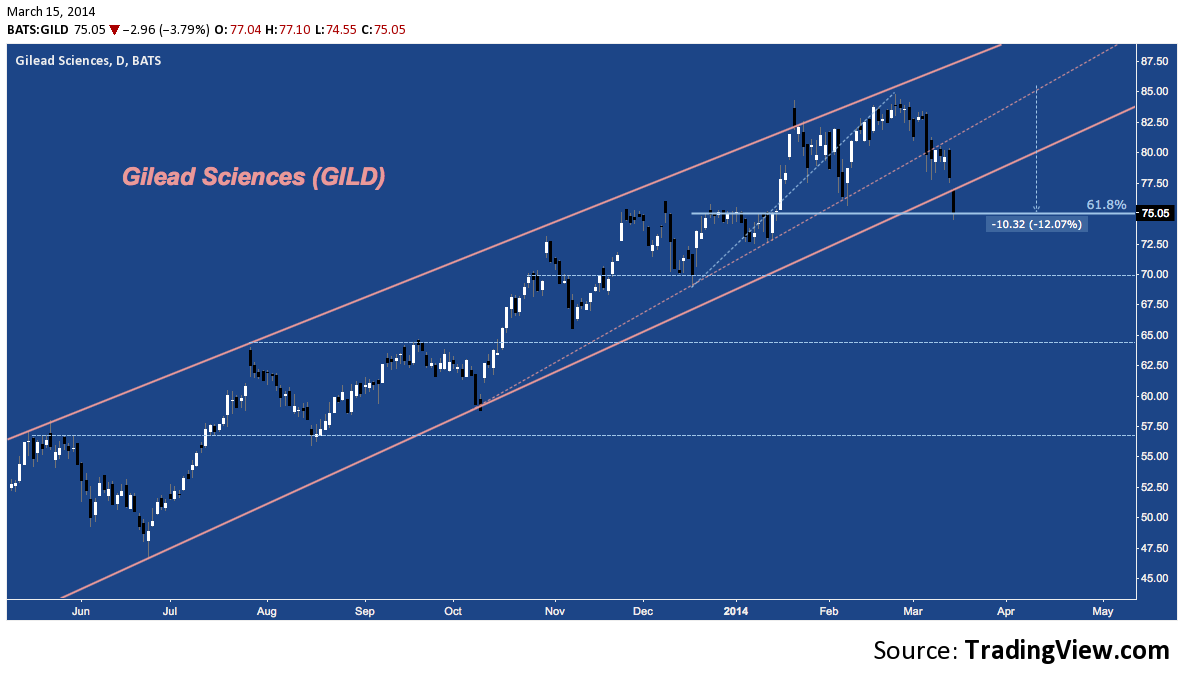
Gilead Sciences (GILD) – Daily: Channel Break Down
Simple look here: GILD broke 2013-2014 rising channel support last Friday with a breakaway gap down and continued mark-down almost all day long. Finishing at horizontal support, the modest late-session bid wasn’t enough to avoid activating a double top that targets $65-$67 where below $75.
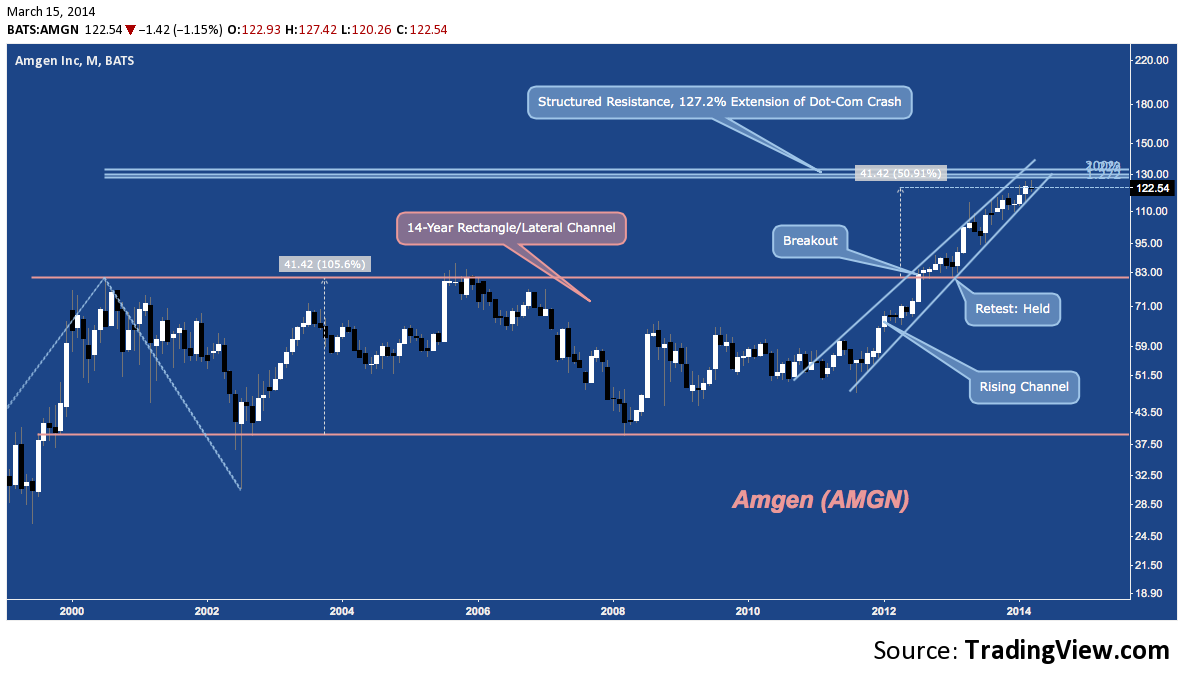
Amgen (AMGN) – Monthly: Structured and Measured Move Resistance
Like BIIB, Amgen just hit the measured move target of a lengthy consolidation pattern (here 2000-2014) it broke from around the beginning of 2012. Though AMGN‘s move only covered a fraction of the distance, like it’s more volatile peer it is looking at major structured resistance just above and has not fared well thus far in March.
Celgene (CELG) – Weekly: Structured Resistance
Celgene caught a lot of positive attention last week; but that didn’t help it surmount structured resistance near $160.
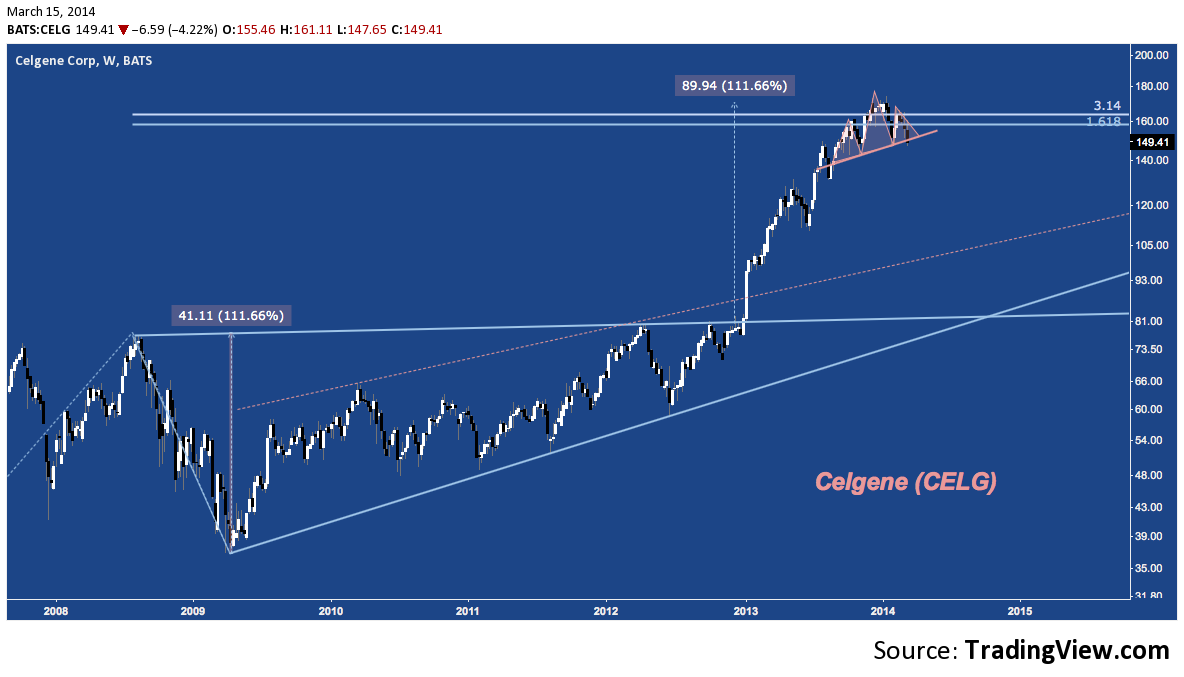
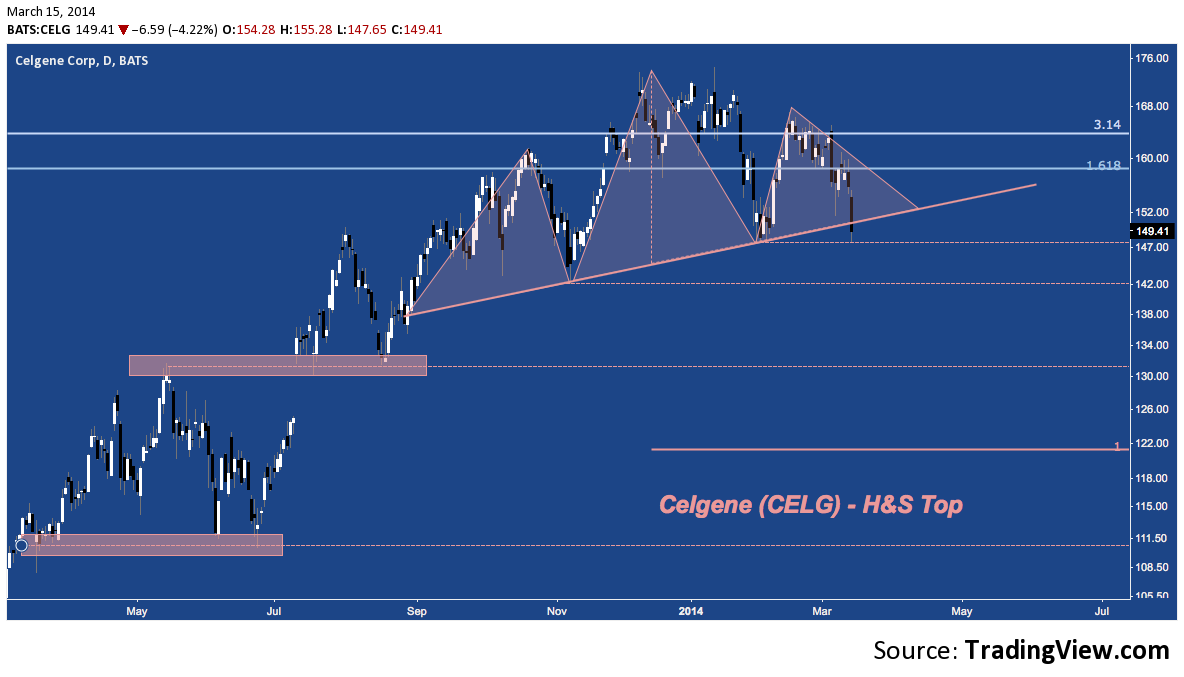
In fact, CELG ended Friday just below the neckline of a 6-month H&S Top pattern. Horizontal support near $147 held into the end of the day, deferring pattern follow through or failure into next week. Below major horizontal support rungs are noted, with the H&S Top measured move targeting $122.
Celgene (CELG) – Daily: H&S TOp
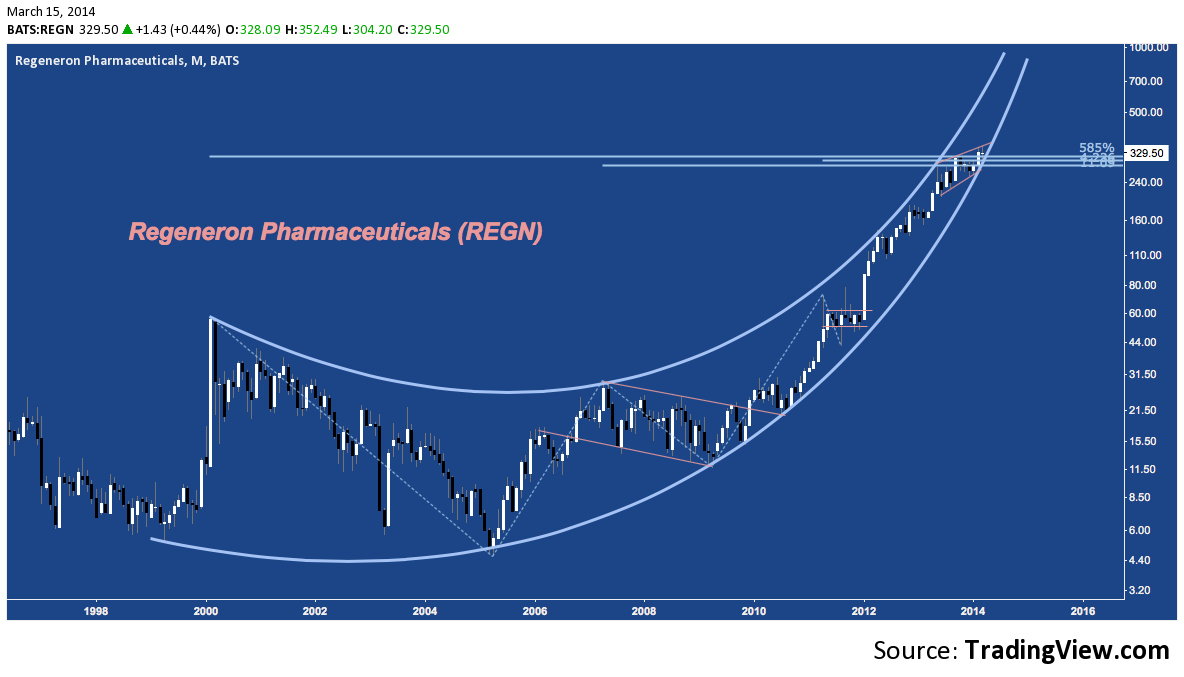
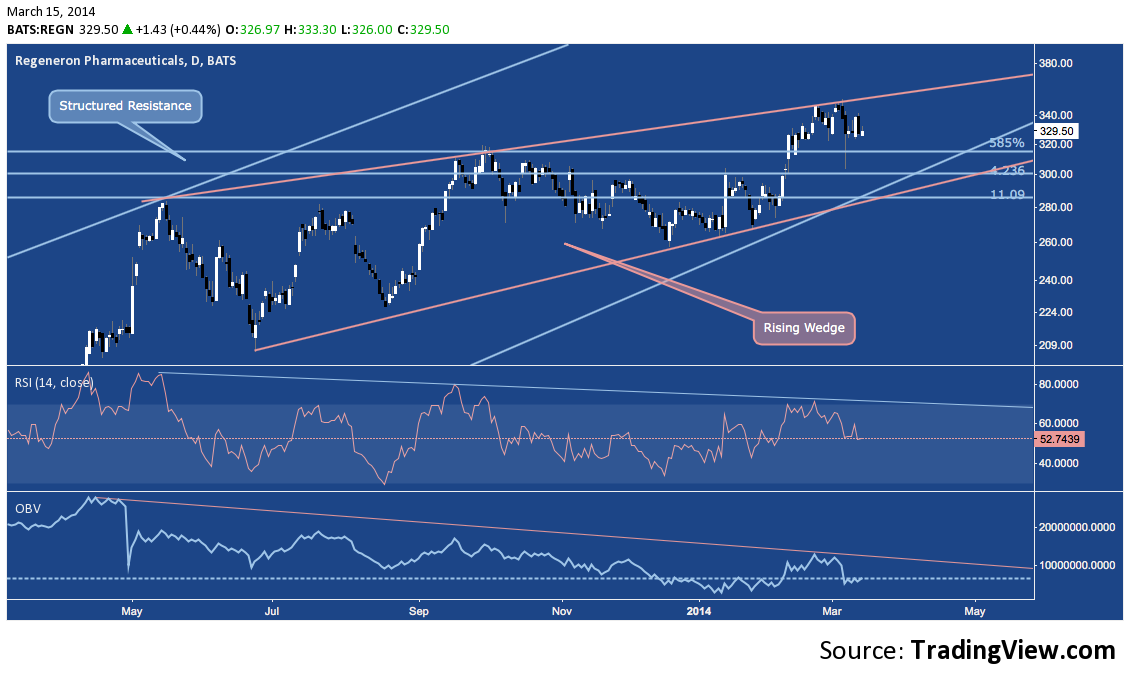
Regeneron (REGN) – Secular Arc
Regeneron’s march higher is representative of the potential biotech stocks are capable of when a company’s R&D, regulatory and broader industry stars are aligned. Will the FDA’s recently noted concerns about “adverse neurocognitive side effects” surrounding PCSK9 inhibitors materially impact REGN‘s fortunes? Maybe: certainly the the stock’s launch path and major structural resistance near $325-$250 suggest there’s heightened potential for a negative “catalyst” to enter the scene.
Here’s a closer look at REGN‘s rising wedge at structured resistance. Though it may beggar belief when looking at it’s price, dying momentum and a deterioration of constructive volume have been braking the stock’s upside potential for a year. Now the stock is at wedge resistance, suggesting at least a correction to support may be in the offing.
Regeneron (REGN) – Daily: Rising Wedge, Retrenched Momentum
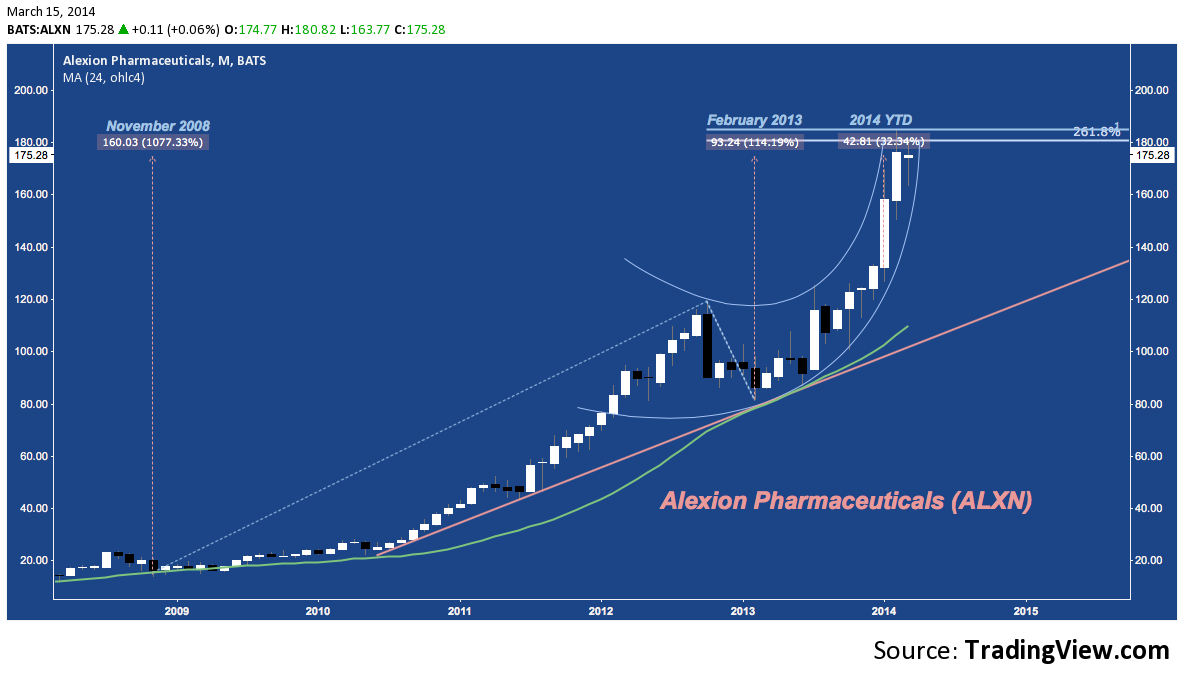
Alexion (ALXN) – Monthly – To Infinity and Beyond
As impressive as REGN‘s arc is, Alexion wins the category. Though the time period’s are different, ALXN‘s is also up against structured resistance. Though the scenario shouldn’t be disregarded, it’s tough to imagine material upside here without resolving this arc with a sideways consolidation, at minimum.
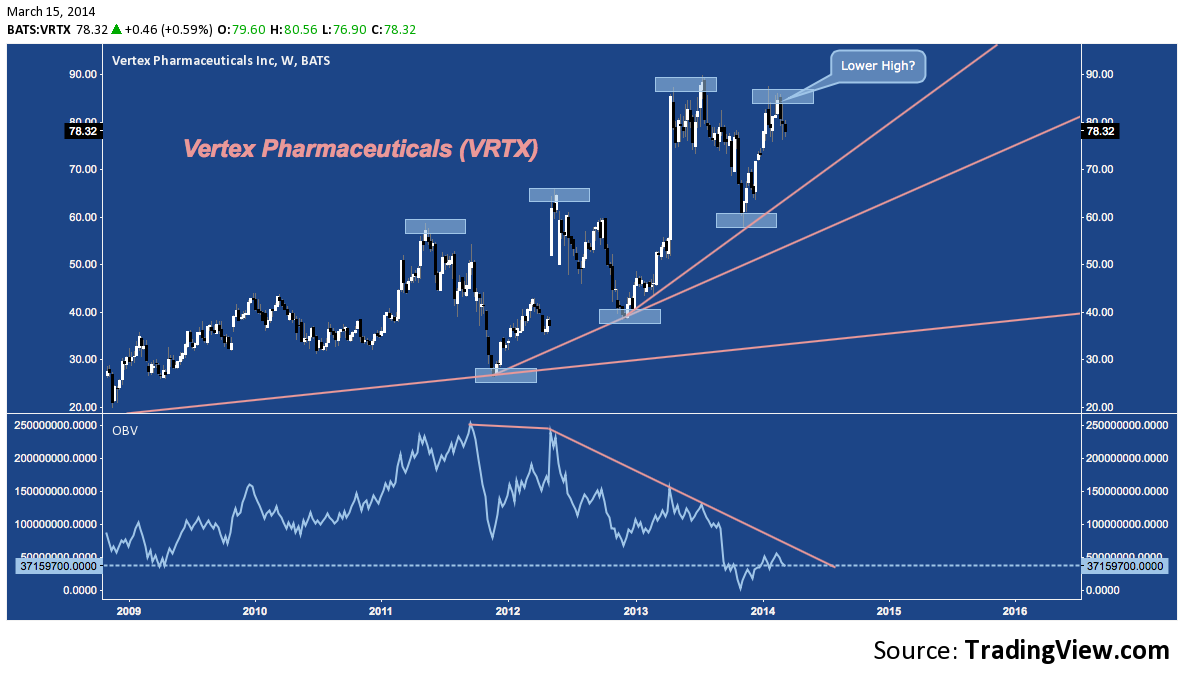
Vertex (VRTX) – Weekly: An Interrupted Succession
Vertex’s chart just doesn’t have the parabolic elan that many of it’s peers do. Still, it’s up almost 100% over the last 15 months. The stock has displayed a volatile yet orderly stair-step pattern higher over the last several years; but January/February 2014’s swing high near $85 is the first to establish a lower high. Has the dendritic trend progression (where trend trajectories continue to split off, pointing higher and higher) finally resulted in exhaustion? The sliding On-Balance Volume (lower panel) since mid-2012 hasn’t “mattered” yet; but a lower high here suggests the point where it begins to is just ahead.
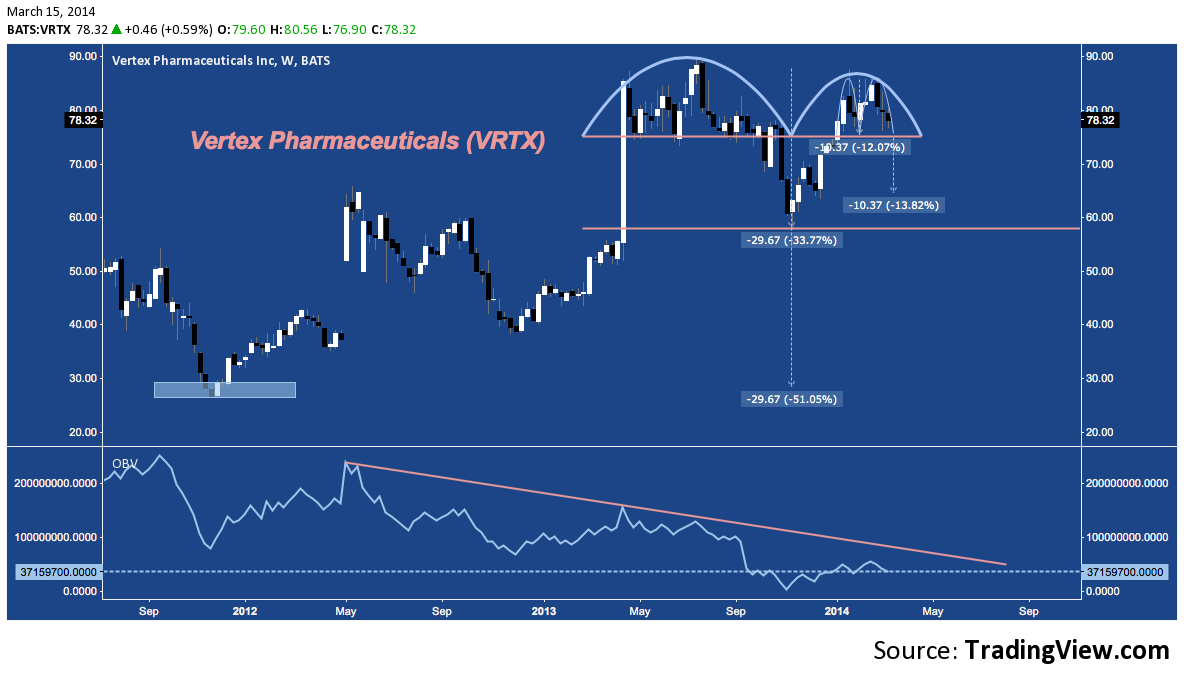
Same time frame, but zoomed in on that lower high, we see that VRTX is exhibiting two potential double tops. The larger plots a huge measured move into the mid-20s to late 2011’s bottom, while the smaller (nested in the lower high) measures to the low 60s. The sliding OBV is a major concern.
Vertex (VRTX) – Weekly: Double Top(s)
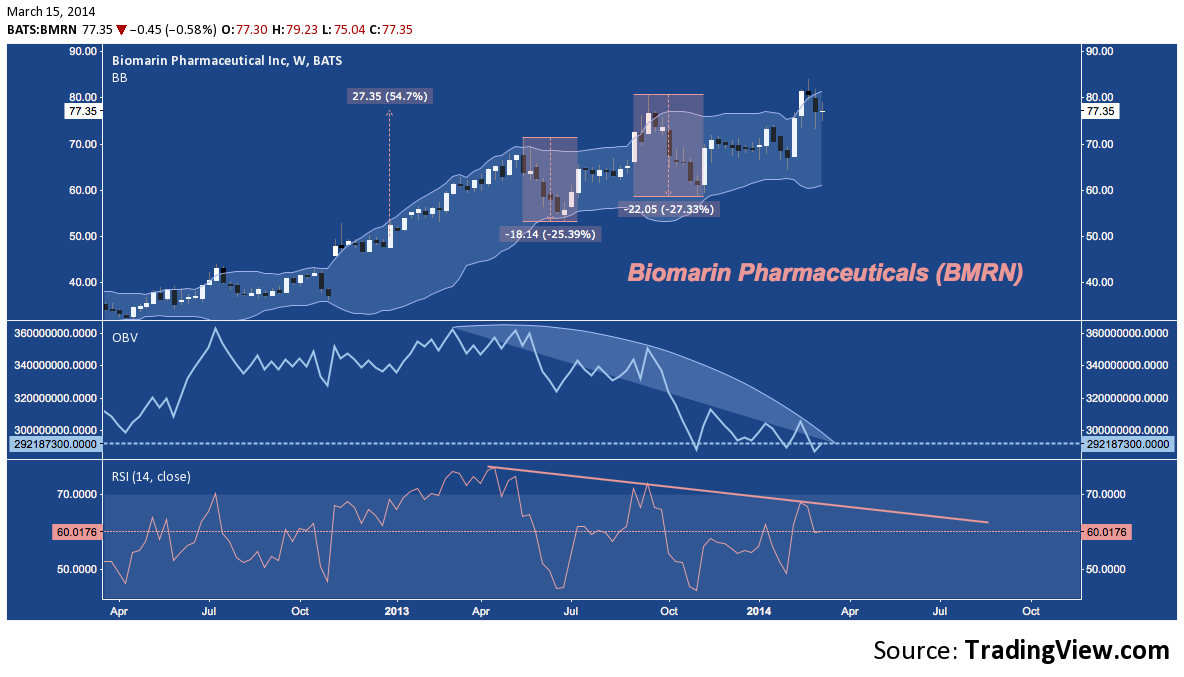
Biomarin (BMRN) – Weekly: Fading Tops
Biomarin Pharmaceuticals has also been exhibiting a series of higher highs and higher lows (as befits a rising trend), with the last three major swing highs breaching it’s higher Bollinger Band (BB) on stalling momentum and deteriorating volume. The previous two saw multi-week corrections shedding over 25%. Now, it’s time to consider whether the third BB break will follow the same script.
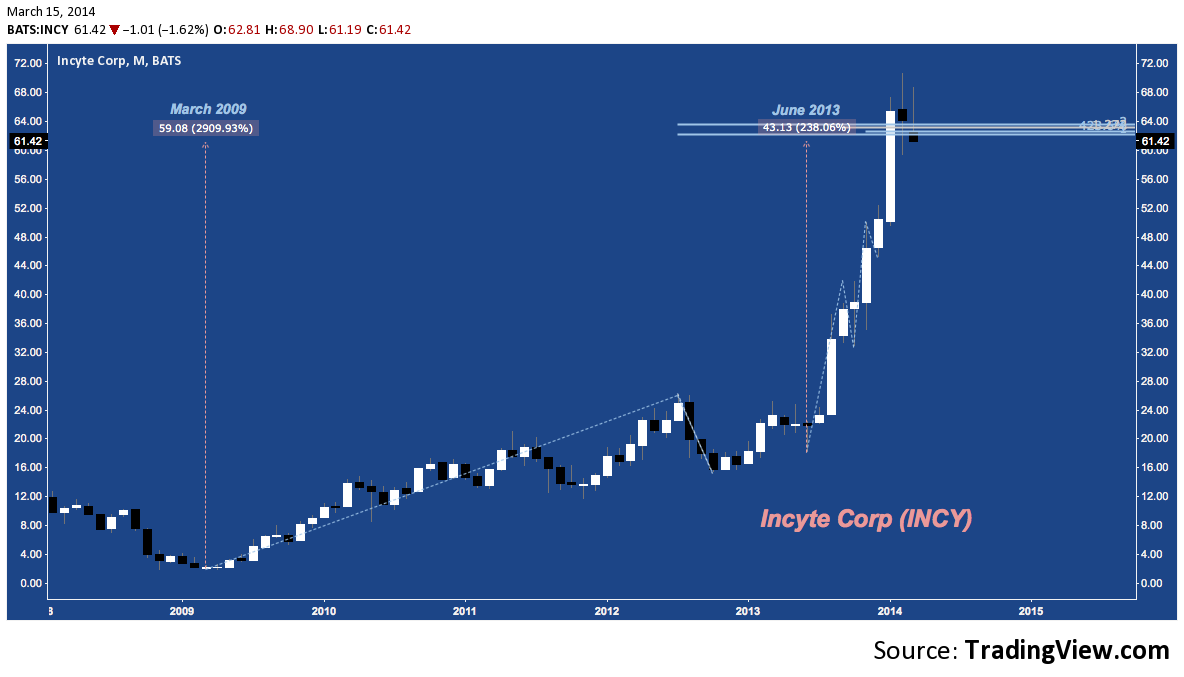
Incyte (INCY) – Monthly – Structured Resistance
Up almost 3000% since the 2009 low and +238% in the last 9 months, INCY has been a winning Biotech lotto ticket. That said, February and March haven’t been kind to latecomers in th estock: structured resistance around $63 was broken in January and then faded further into the rear-view last month, only to bearishly reassert itself (a common occurrence called an overthrow) – a pattern that happened again in the first half of March as well.
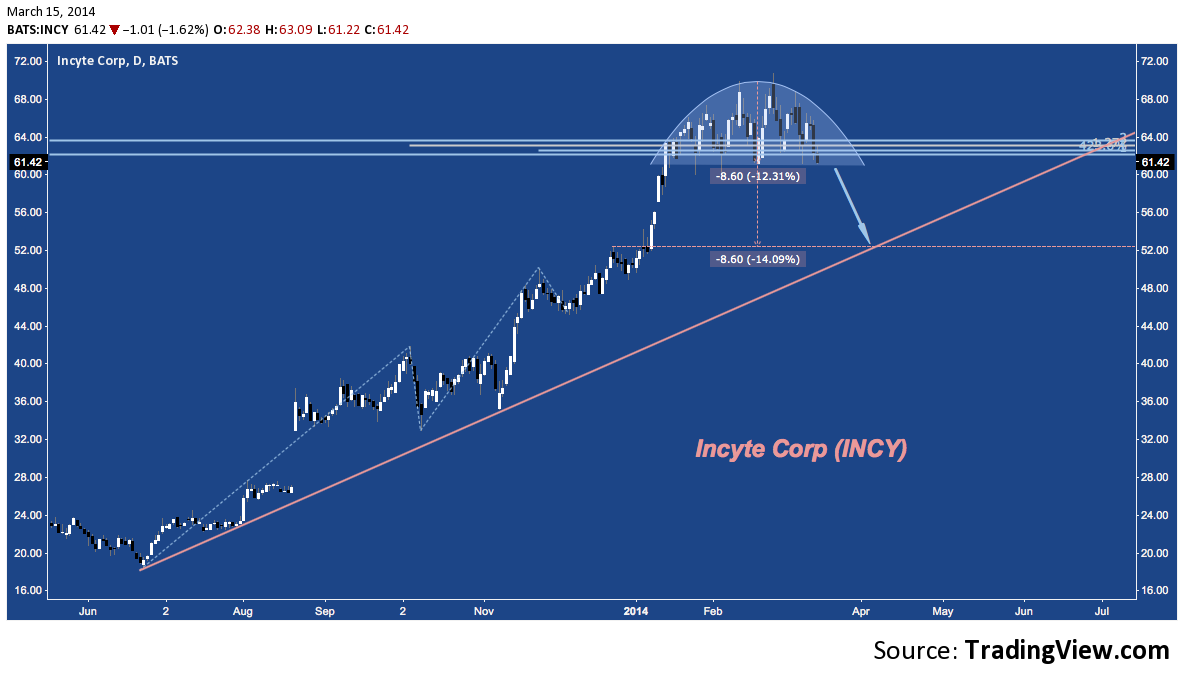
The insistence of Structured Resistance on being acknowledged is readily evident below: INCY has made multiple attempts to escape but continues to be magnetized, creating a perfect rounded top/saucer top. This pattern implies a measured move toward $52, coinciding with rising trend line support some 14% lower:
Incyte (INCY) – Daily: Rounded Top
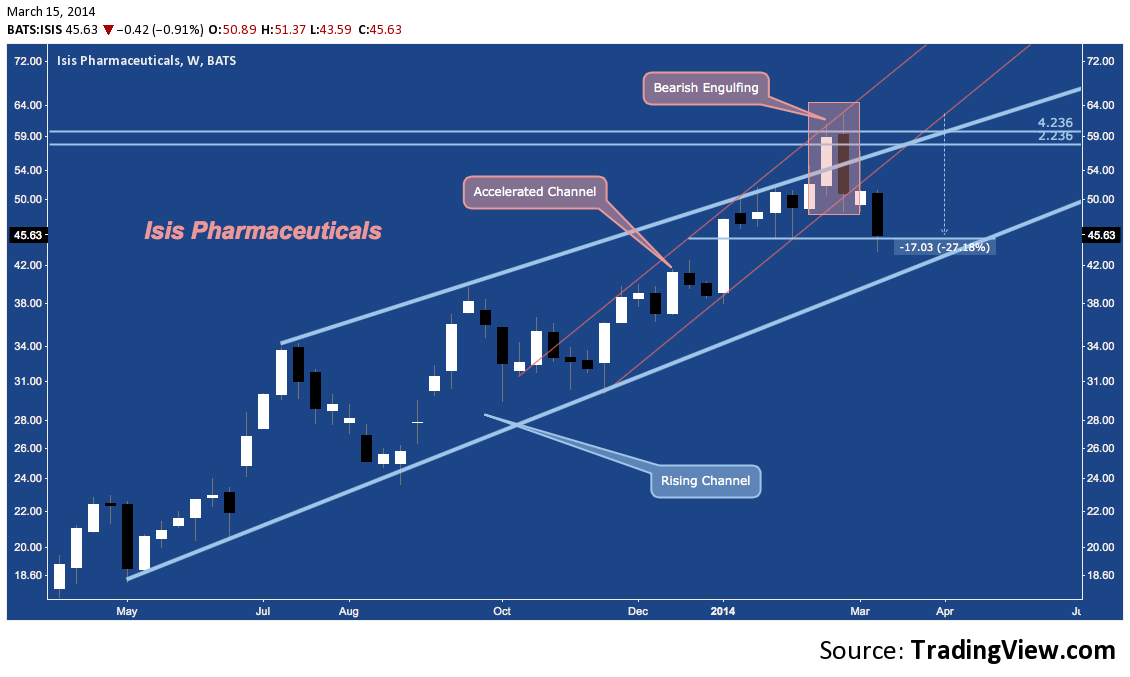
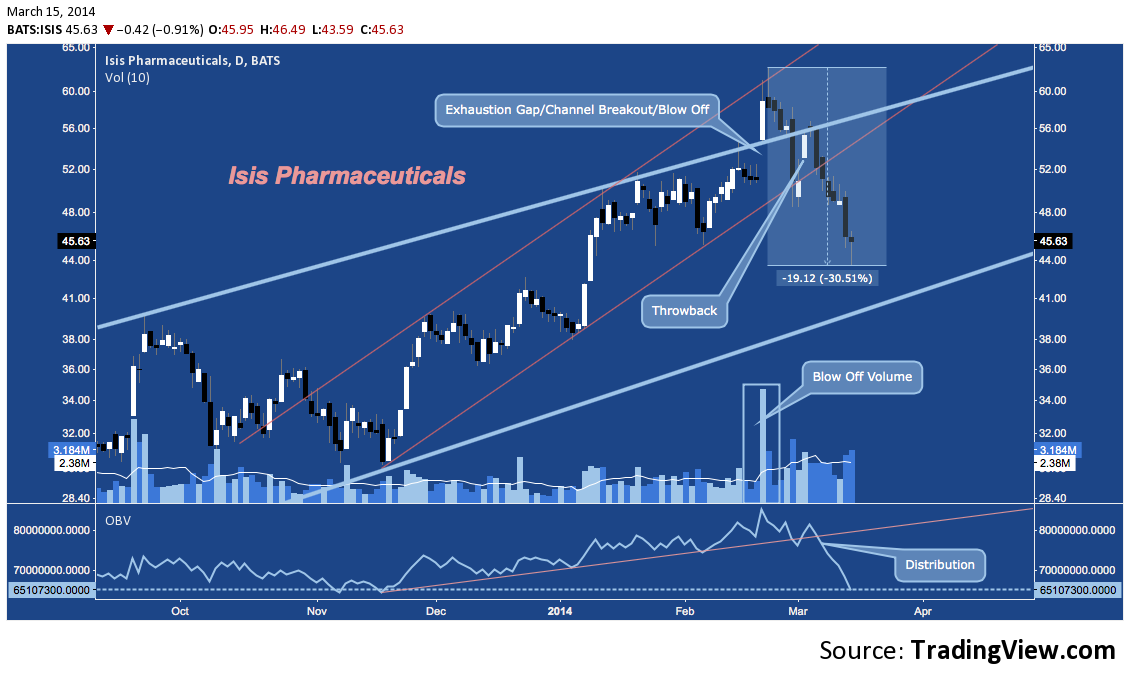
Isis Pharmaceuticals (ISIS) – Weekly – Failure at Structured Resistance
Isis is not one of the top 15 Biotech stocks by market cap; but it is widely followed in the space and is representative of the deterioration underway over the past few weeks. After breaking out higher from it’s 9-month rising channel (blue parallel lines), ISIS ran higher with the broader market in mid-February, following the smaller accelerated channel (orange parallel lines) underway since November. An exciting time to buy, apparently; but this more acute trend immediately ran afoul of structure resistance near $60, posting a bearish engulfing pattern that created a breakout failure from the blue channel. Now Isis is -27.5% from it’s peak 3 weeks ago, ending last Friday at major near-term horizontal support near $45.
ISIS is an excellent technical study of the Blow Off Top:
- Beginning in November, it embarked on an orderly-but-aggressive channel-within-a-channel (orange).
- In Early January, the trend changed where smaller channel and larger channel resistance coincided. The stock grinded through a broadening formation, moving mostly sideways through late February.
- On huge relative volume, ISIS broke above it’s moderate channel (blue), gapping higher to touch orange channel resistance for the first time in 6 weeks. This kind of gap/volume combination above an already strong channel higher places an increased burden of proof on a stock’s bullish thesis. Usually unsustainable, the gap is aptly called an exhaustion gap, denoting the arrival of late-to-the-party bulls, opportunistic breakout traders and short-covering capitulation. Altogether, this creates a blow off top, quickly proving all three of these market contingents wrong.
- the stocks slides below blue channel resistance, and then bounces at orange channel support, creating a throwback. This bounce is halted at the blue rising channel trend line resistance made so familiar by the Jan/Feb broadening formation, which begins the second leg of an aggressive decline that has amounted to 30.5% at it’s worst.
Isis (ISIS) – Daily: Blow Off Top
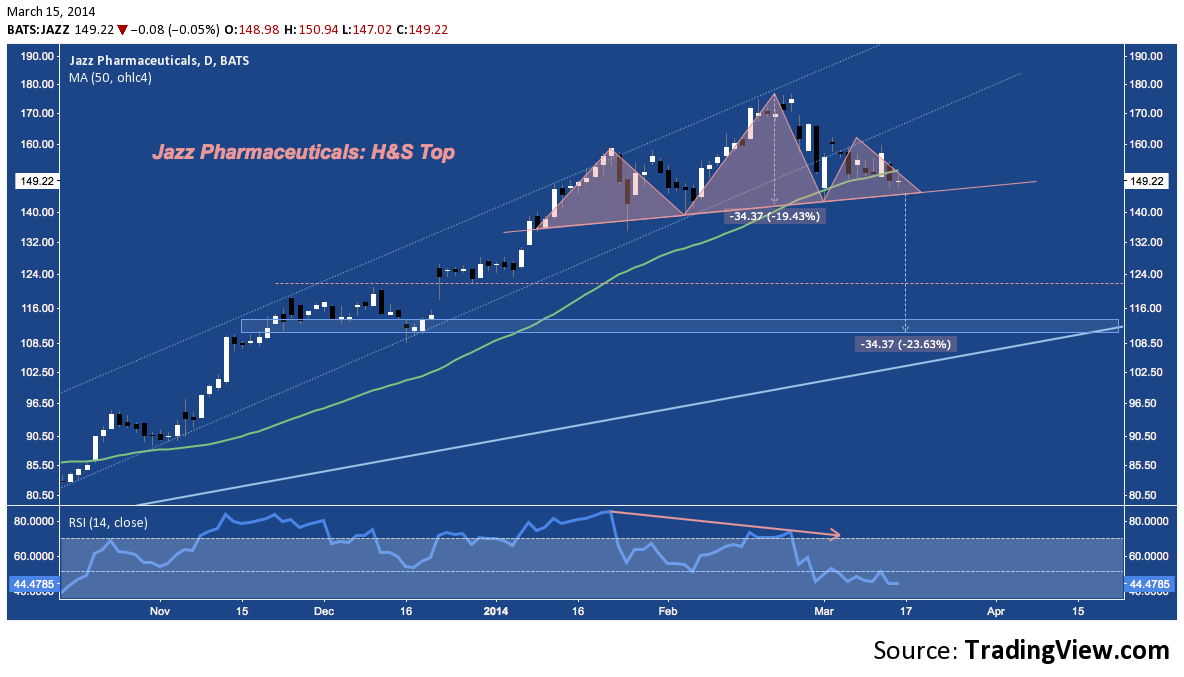
Jazz Pharmaceuticals (JAZZ) – Daily: H&S Top
Jazz broke below rising channel support at the very end of February on flagging momentum, finding support and subsequently completing the right shoulder of a potential H&S Top pattern. Though the pattern hasn’t yet activate, JAZZ ended the week on a quiet but somber note, rejected in its modest attempt to recover it’s 50-Day SMA after breaking below it on Thursday for the first time since mid-October.
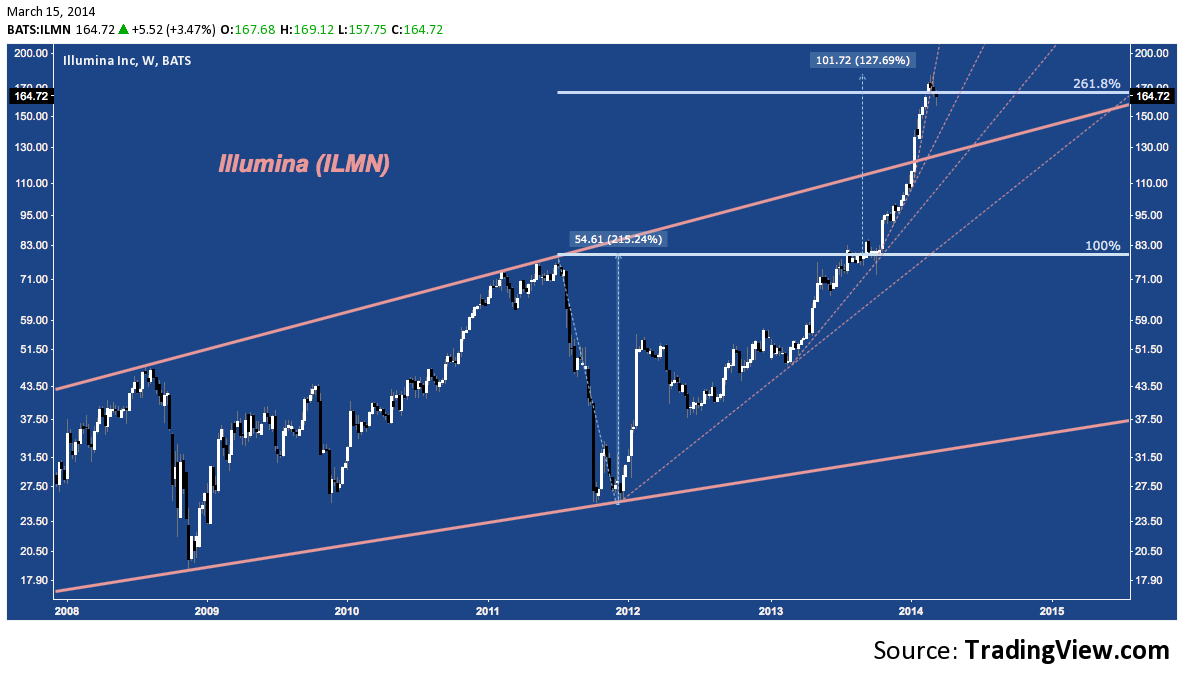
Illumina (ILMN) – Weekly: Measured Move Complete
ILMN is another excellent example of dendritic trend progression, where higher lows continue to mount, implying more acute and ultimately unsustainable trend paths. After breaking from it’s massive Ascending Broadening Wedge (ABW) late last year, Illumina is hesitating at the 261.8% extension of 2011’s 215% range. Breaking it’s latest (impossibly steep) trend line, a healthy near-term scenario sees ILMN pulling back in a return move to the upper ABW trend line to burn off some of the froth that is billowing up here.
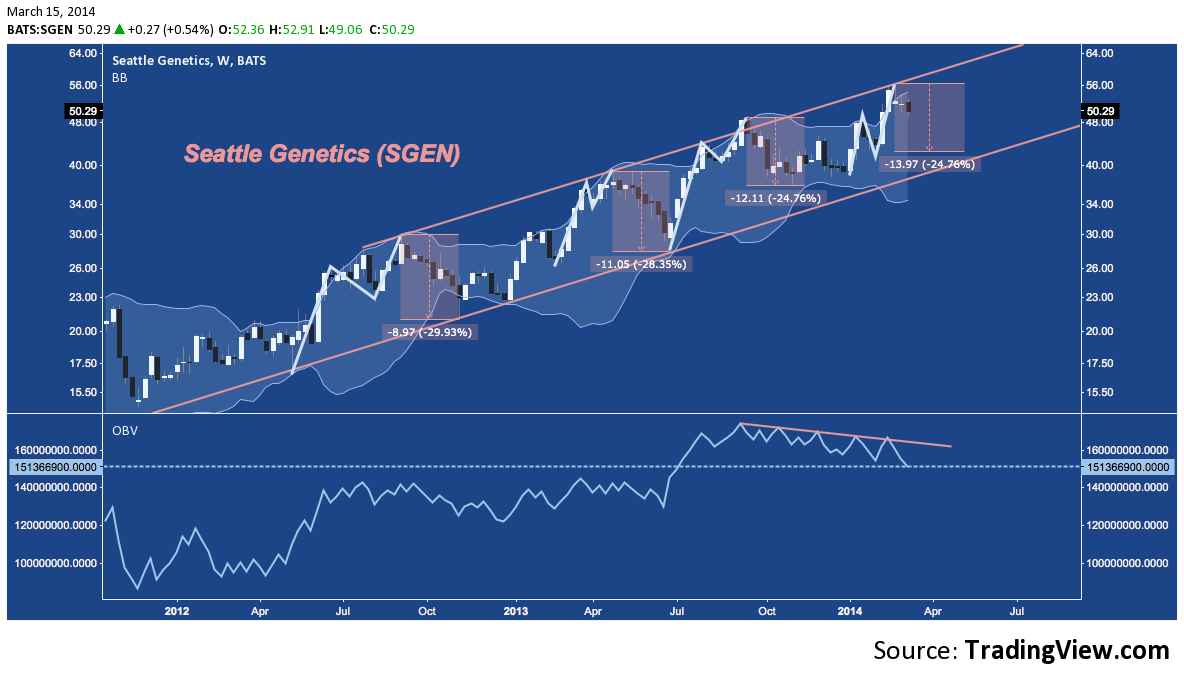
Seattle Genetics (SGEN) – Weekly: Rising Channel Corrections
SGEN is oscillating through a very consistent rising channel, exhibiting a repetitive sequence of interaction with it’s Bollinger Bands where price a) breaks the upper BB, b) pulls back modestly, c) touches the upper BB on a higher high, and d) corrects more deeply into proximity with the lower BB. Over the last 18 months, this has created 3 deep corrections of -25-30%.
All have been bought, of course, suggesting great buying opportunities. Now a bit off rising channel resistance and back inside the upper BB on deteriorating volume, another such correction may be in store:
Cubist Pharmaceutical (CBST) – Monthly: Arcing into Resistance
Cubist has nearly completed a 12-year ABCD, complementing 2002-2006’s 530% gain with a 495% measured move off the 2009 low into cluster resistance. The latter half of this latest 5-year move has been through a moderate arc that is beginning to turn more acute:
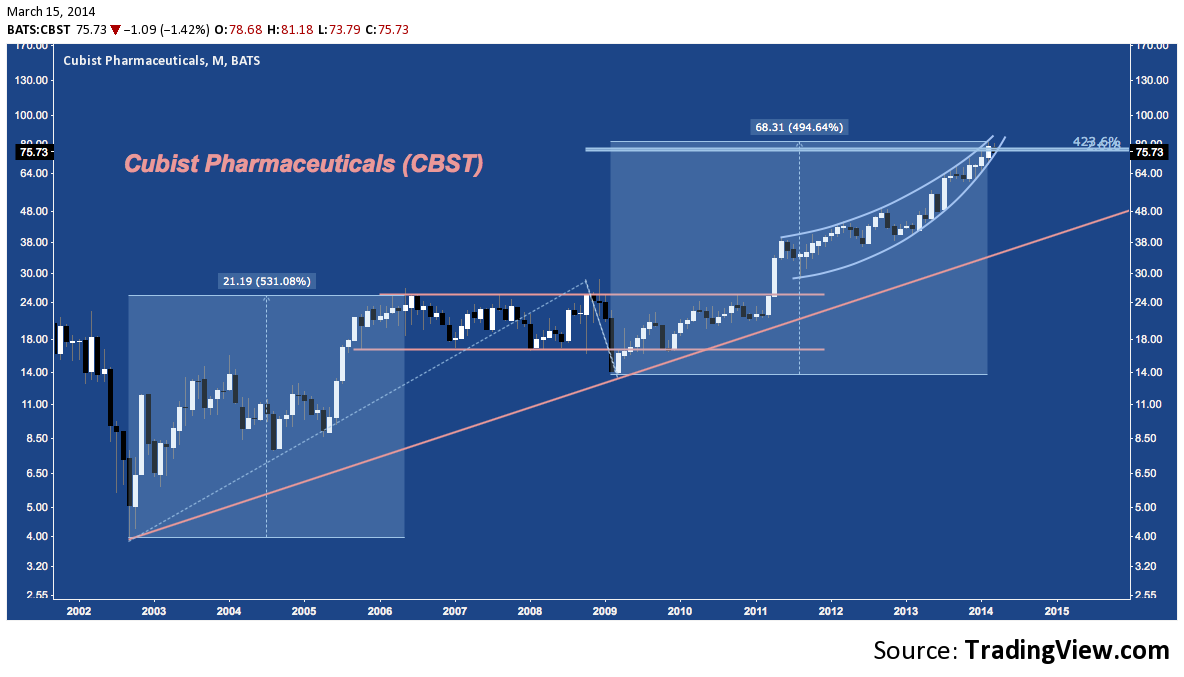
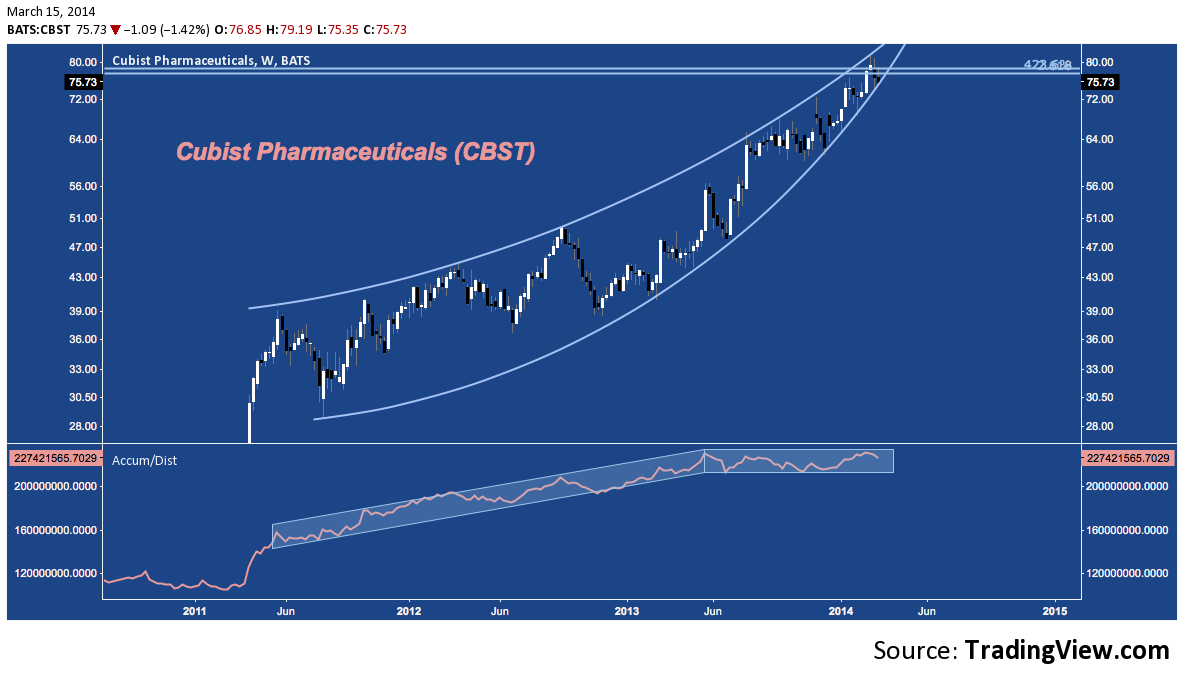
Here’s a closer relief of Cubist’s arc (Picasso would approve of the geometric harmony), with sellers beginning to assert themselves just as the stock runs into cluster resistance and bounding trendlines taper to a point:
Cubist (CBST) – Weekly: Arc with Stalemated Breadth
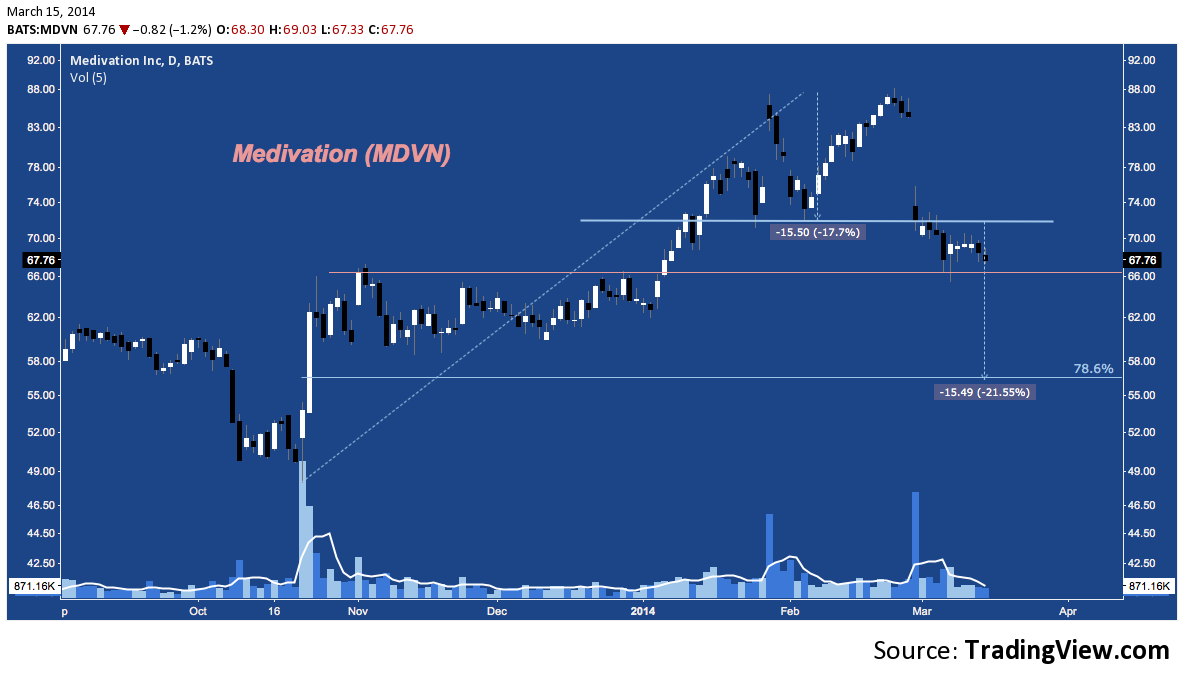
Medivation (MDVN) – Daily – Anti-Levitation
Medivation broke below double top support near $72 to open March. After a tepid bounce off horizontal support near $66, the stock has consolidated, but ended the week on a down note with it’s lowest close since the beginning of January. Follow through to the Double Top’s measured move suggests a drop to $56.50.
And last up:
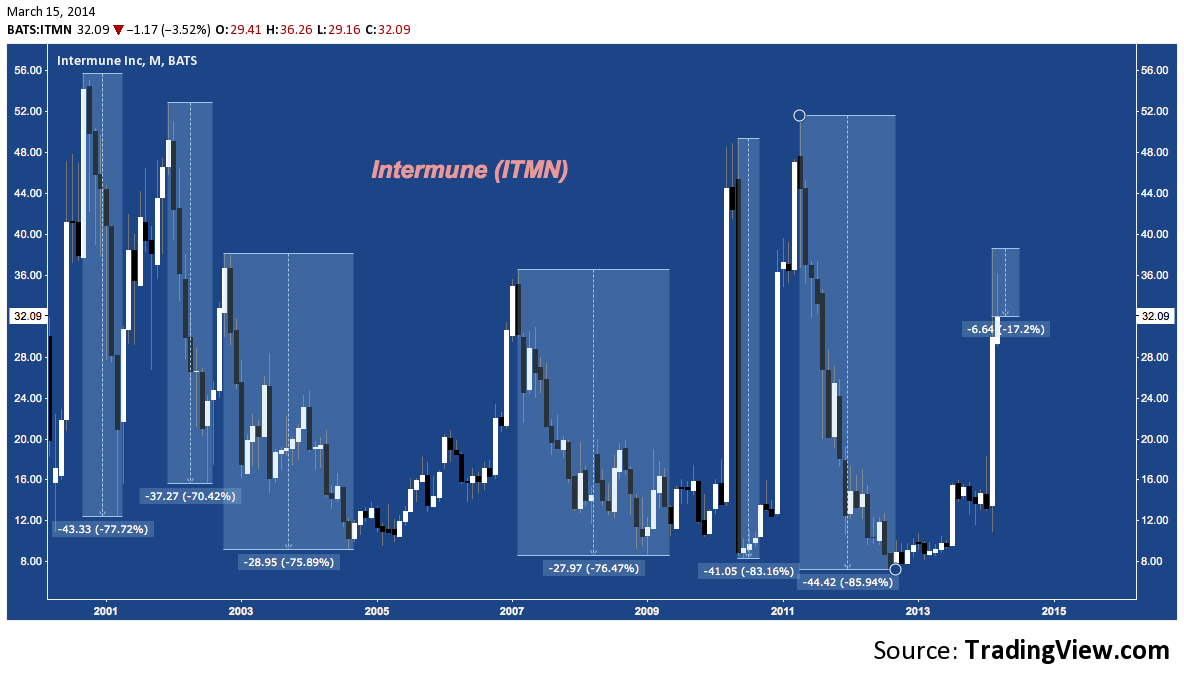
Intermune (ITMN) – Monthly: Manic Depression
If Bill Murray became a Biotech play, Intermune would be that stock. Like the protagonist of Groundhog Day, ITMN has gone through the same motions time after time – rallying furiously, presumably on promising clinical trials, etc. – only to spectacularly fail over and over. Somehow, ITMN has fallen more than 70% on six distinct occasions over the last 13 years. And yet, “investors” with a penchant for extreme gaming continue to punt on the stock. In the latest (possibly – probably – the 7th) iteration, Intermune spiked over 150% in February on successful trial results for it’s lung disease drug Esbriet, but is off -17.2% in March.
Is this time different; or will the stock despondently drive it’s stolen pickup truck off the FDA’s rock quarry cliff yet again?
Twitter: @andrewunknown and @seeitmarket
Author holds no exposure to instruments mentioned at the time of publication. Commentary provided is for educational purposes only and in no way constitutes trading or investment advice.
“Lab” image courtesy of 188pair.com
Any opinions expressed herein are solely those of the author, and do not in any way represent the views or opinions of any other person or entity.


