The S&P 500 (NYSEARCA: SPY) has just about completed its best reporting season in a heck of a long time, with growth in earnings of 25% and sales of 10%.
It’s hard to complain.
Not to be outdone, the Canadian TSX is on track to post 20% earnings growth and 16% sales growth.
Bond yields, while higher relative to the past half decade, remain somewhat contained in a range that the market appears comfortable with.
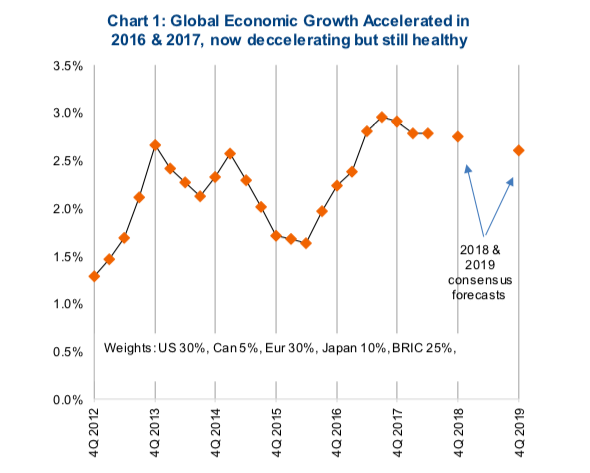
The global economy continues to grow at a decent pace and this growth is very broad based (chart 1 below). This is the ‘glass half full’ side of the current macro picture. The market cycle may be old, but the foundation remains strong.
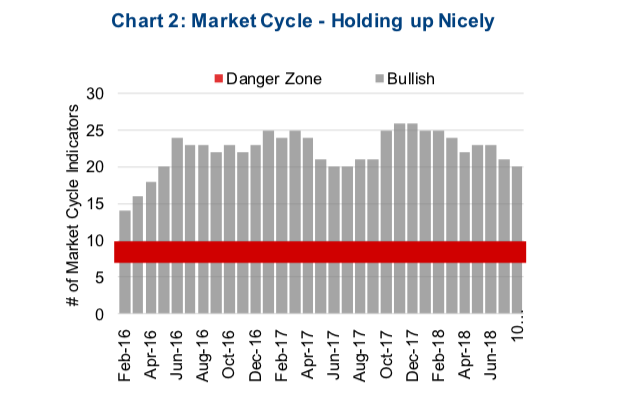
Our market cycle framework remains of the opinion that this cycle, while getting long in the tooth, still has room to run. The market cycle is comprised of 30 indicators that have historically shown varying degrees of efficacy in predicting the future path of the market. Some work well in some cycles, other indicators work well in other cycles.
That is why we use 30 of them. These indicators range from interest rates, economic indicators, commodity prices, market prices, sentiment, valuations to fundamentals. Currently 20 of the 30 indicators remain bullish, which is lower than a six months ago, but well above the warning levels of 7-10 (chart 2 below).
The solid underlying foundation has enabled the markets to absorb bad news (there is always some). Most recently this has been the deterioration in the outlook for developing markets. The plight of Turkey which has seen its currency devalue substantially over the past few months feeds the ‘glass half empty’ argument. Turkey is pretty small potatoes when it comes to the global economy, and its total equity market is less than that of McDonalds. Still, there is a legitimate argument that developing economies, especially those more vulnerable to current account deficits and borrowing in non-local currency, will be the canary warning of pending trouble for the global markets.
A legitimate argument, and we would note that the indicators in our market cycle framework that are relevant to developing markets have been negative for some time. We continue to believe investors should steer clear of developing markets (aka Emerging Markets) at this point the market cycle and this recent weakness should not be viewed as a buying opportunity in Emerging Markets.
The Fed is tightening faster than other central banks, some of which are not tightening at all. Quantitative easing is transitioning to quantitative tightening, likely keeping upward pressure on the U.S. dollar. These factors are all negative for emerging markets.
So here we are in an aging bull market with a solid foundation but with a few flare ups that are causing concern. We believe, given our market cycle indicators, this cycle does have any more room to run. We believe however, that starting to become a bit more conservative or defensive isn’t a bad idea.
Bear Beta
For those investing in or managing equity portfolios, how could you become more conservative?
While you could simply sell and sit on cash, this would forgo benefiting from any continuation of the current cycle. Another concept is to use ‘bear beta’. By this, we mean reducing the exposure to companies that have a higher bear beta and moving into companies with lower bear beta.
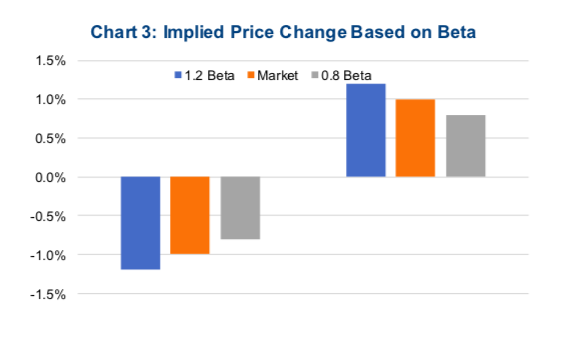
Bear beta is different than beta, a popular calculation in finance. For an individual company traditional beta is the best fit slope of a line comparing index returns to the stock returns over many time periods, often weekly. A high beta score, over 1, implies that if the market goes up 1%, the share price, on average, should go up by more than 1%. Conversely, if the market drops by 1%, the share price is expected to drop by more than 1%. A beta of less than one implies the share price will move less than the market, both up and down (chart 3 below).
However, if the goal is to tilt a portfolio to be less risky, if we are nearing the end of cycle and a bear market, we are more interested in identifying companies who would be expected to drop the most and least. We are less interested in upside exposure. Bear Beta is the same calculation; however, you are only considering periods when the overall market declined. Similar to traditional beta, a high Bear Beta implies the share price would fall more than the market and a low Bear Beta should fall by less.
This analysis can be applied to a portfolio of equities (assuming they have a long enough price history) to understand which positions you would expect to hurt performance the most, should we run into a bear market. Reducing exposure to these in lieu of companies with a lower Bear Beta should help tilt the portfolio to be more defensive.
Sub-Industry Perspective
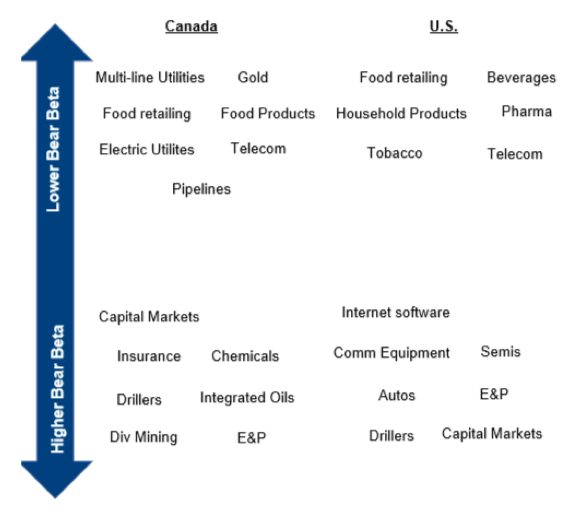
This analysis covers all sectors and underlying sub-industries for both the TSX and S&P over the past 20 years. At the sector level, it is not too surprising which sectors are at greater risk of bigger declines should a bear market materialize.
In Canada, technology, energy and industrials score the highest. Consumer staples, utilities and telecom were the most defensive. However, digging down to the sub-industry level provides greater insight. Within the materials sectors, the diversified mining, chemicals and forestry all had high Bear Beta scores, while gold was much more defensive. Similarly, in financials, the banks were middle of the road while insurance was higher risk.
The U.S. market results were similar but also different, given the types of companies available. Notably health care was much more defensive in the U.S. given large pharmaceutical companies.
Chart 4 below includes several industries in Canada and the U.S. that have lower and higher Bear Beta scores. Note the industries near the top of the chart have lower Bear Beta scores and industries at the bottom are higher Bear Beta scores. If you are considering tilting a portfolio to be more defensive, reducing from higher Bear Beta industries and adding to the lower Bear Beta industries should help better prepare your portfolio should the bear come soon.
What we are Reading
The Connected Wealth team tends a good amount of reading. Most of the books we are reading tend to be devoted to non-fiction financial or economics related subjects, but not always.
In this new section of Market Ethos, we will be sharing some thoughts on books we have recently finished that may be worth your time. Maybe someday we will even start a book club.
The Most Important Thing Illuminated – Howard Marks
Warren Buffet called it “a book worth reading”, the entire Connected Wealth team echos that statement. After initially being suggested by one of our analysts as a Caribbean beach read, when I returned from the trip, a copy was purchased for each team member.
Written by billionaire hedge fund manager Howard Marks, one would think this is a typical “how to invest” book but that is not the case. It is an easy to read, well written, and illuminated by lessons learned from years of practical experience.
Instead of a formulaic rendition of a step by step process on how to become a billionaire hedge fund manager, he starts by explaining there is no proven formula in investing. Mechanical trading rules work great, until they do not. There is a phycological aspect to investing: it is more of an art than a science.
Marks talks about second level thinking as the key to investment success. Generally speaking, this is understanding the mass opinion, questioning it and formulating your own thoughts. Investing in your high conviction, non-consensus ideas and letting the market participants eventually come to a similar conclusion; hopefully in the masses.
Second level thinking is hard and few have the discipline to employ it, but Marks cites it as the mindset necessary to be successful in investing. Following the herd and buying fads at their top is the most dangerous thing you can do in investing. There are no new buyers out there and the asset is in a goldilocks scenario, where all positive information is already priced into the asset. Just think about past bubbles, they all exuded those characteristics: Nortel, Valeant, Bitcoin….
He emphasizes that when a stock appears the most risky, it is likely because the least faithful investors have already left. When a stock seems at a safe point, it is probably quite risky and demonstrating many of the characteristics outlined above.
There is much more to this book than outlined above. It is a reasonably easy read and does encourage deeper thinking when investing. We would recommend picking up a copy and giving it a read, especially when the markets just are not making sense. He provides some sound advice on staying the course and taking advantage of opportunities when it feels like you should be doing the exact opposite.
Charts are sourced to Bloomberg unless otherwise noted.
Twitter: @sobata416 @ConnectedWealth
Any opinions expressed herein are solely those of the authors, and do not in any way represent the views or opinions of any other person or entity.


: Showing Some Signs of Emerging Strength")
