The Australian Dollar appears to be breaking beneath support, suggesting its next downward phase might have begun.
Herein we show some likely targets for the CurrencyShares Australian Dollar Trust (NYSE Arca: FXA).
Our medium-term bullish forecast for the U.S. Dollar is consistent with a decline in paired currencies including the Australian Dollar.
For that pairing we believe a downward impulsive pattern is working its Elliott wave count downward from the lower high that FXA made in early 2012. The fifth and final wave of the impulse – wave [v] of ‘C’ – should reach a new low before reversing into a long-term rally.
Australian Dollar ETF (FXA) “Monthly” Elliott Wave Chart
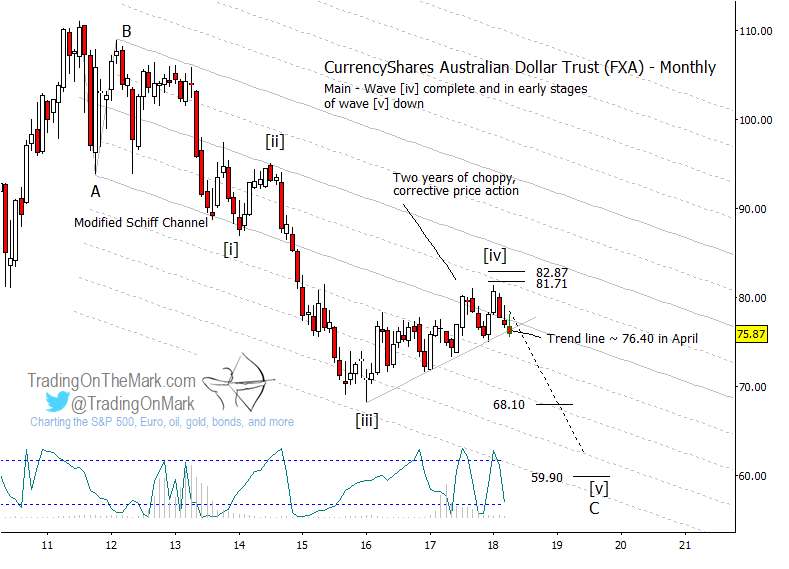
The initial signal of a downturn came when price fell away rapidly from resistance near 81.71, followed by a test of a supportive trend line that has withstood three such tests in the past. During the past week, price has reached slightly beneath that trend line.
FXA bears should watch for a possible decline followed by a bounce and “kiss-back” of the (possibly) broken trend line from below.
Another possible short signal to watch would be a bounce that tests a resistance level such as the boundary of the modified Schiff channel or one of its harmonics, as shown on the monthly chart.
If price continues to fall away from resistance, then primary targets include 68.10 and 59.90. Those are based on Fibonacci relationships between wave [i] and wave [v]. The harmonics of the downward-sloping channel will probably also be noticed during the decline, as the channel has maintained an influence since 2012.
Get this type of analysis for a wide range of markets at Trading On The Mark. Even better, new subscribers can lock in a permanent 15% savings on all services by starting a subscription before May 6. Just use the coupon code “Elliott”.
TOTM’s services get daily chart updates with this type of analysis for a variety of markets including the S&P 500, crude oil, gold, the Euro, the Dollar, and bond futures. There’s an option for intraday trading support too!
Twitter: @TradingOnMark
No position in any of the mentioned securities at the time of publication. Any opinions expressed herein are solely those of the author, and do not in any way represent the views or opinions of any other person or entity.

: Showing Some Signs of Emerging Strength")
