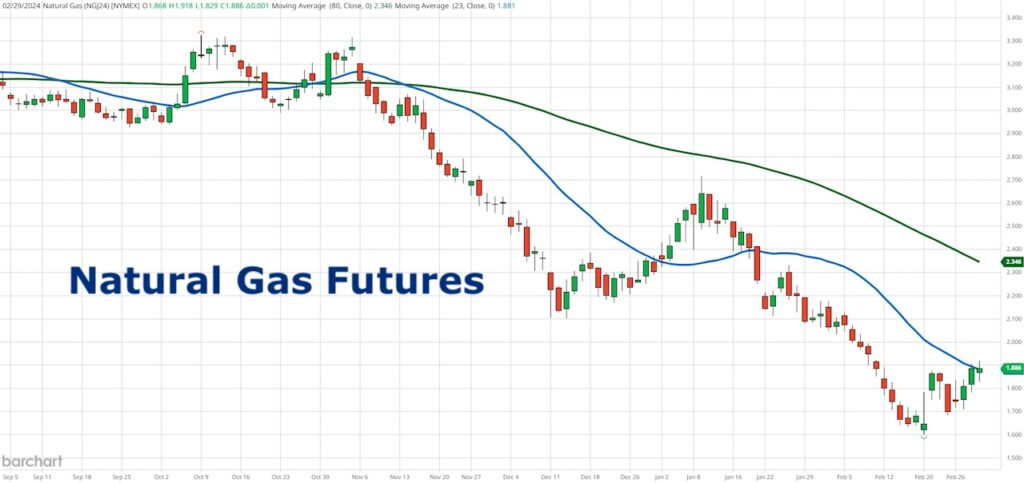
Natural gas prices could be bottoming.
From October 9th, 2023, when prices in futures traded at 3.325 until February 20, 2024, when prices troughed at 1.60, natural gas prices fell nearly 60%.
Plus, nat gas is at the lowest price level in 4 years.
Clearly, in the calculations for assessing inflation, cheap gas prices have helped the overall market and have helped the statisticians to declare inflation is busted.
However, not so fast.
The spot month or April contract, shows price sitting just shy of clearing the 50-DMA or 1.88.
Should the moving average clear and confirm, NGJ24 can move up to 1.95.
The real fun begins over 2.00-2.10.
What about UNG, the ETF?
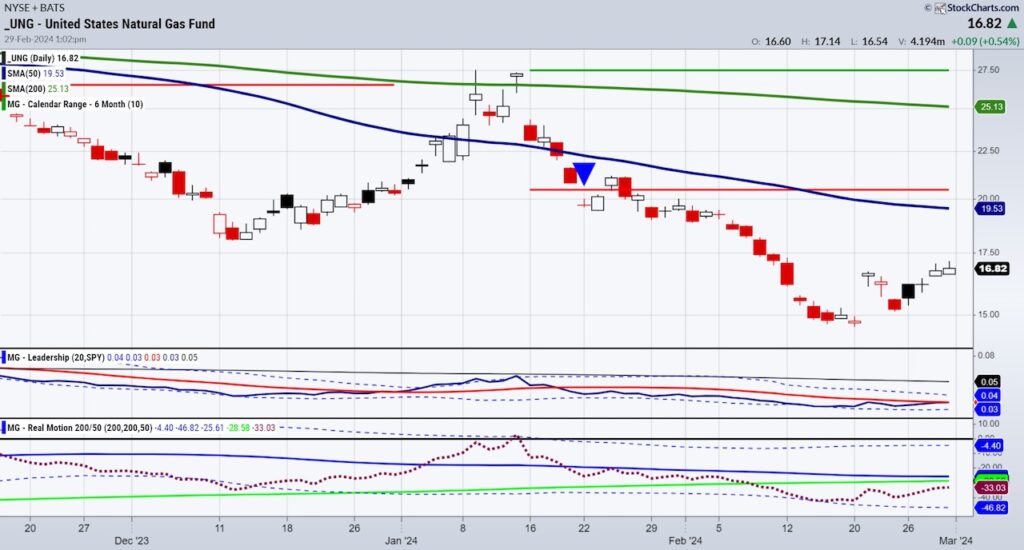
The price on the UNG chart is not near the 50-DMA as it is on the futures chart. This is why we always recommend you watch the underlying commodity to the ETF.
Secondly, right now and quite interestingly, UNG is performing on par with the benchmark or the SPY.
The Real Motion shows that momentum is in a bullish divergence to price as it nears both the 50 and 200-DMAs.
Furthermore, the spread between the 2 MAs is super narrow compared to the spread between the 2 MAs on price.
If we see the futures lead above the 50-DMA as mentioned, then the risk to the recent lows becomes clear and manageable.
Twitter: @marketminute
The author may have a position in mentioned securities at the time of publication. Any opinions expressed herein are solely those of the author and do not represent the views or opinions of any other person or entity.

: Showing Some Signs of Emerging Strength")
