In any given month, there is a greater likelihood that markets will go higher and the economy will expand. And while there are periods of equity market weakness during economic expansions, these tend to be corrections or temporary pullbacks – often providing excellent buying opportunities to put money to work.
However, if the economy is moving into a recession or one is approaching, then the pullback in the equity market is likely NOT a buying opportunity but a trap for investors buying the dip.
There are three key ingredients to be a more successful investor: 1) During most periods, maintain your ideal allocation designed to have the highest probability of reaching your long-term goals. 2) During periods of market weakness that do NOT coincide with a recession, use these as buying opportunities. 3) Reduce market exposure if the prospect of a recession is elevated.
The difficult aspect is that a recession only becomes known months or even quarters after it has started – clearly way too late to provide any benefit to the investment or asset allocation process.
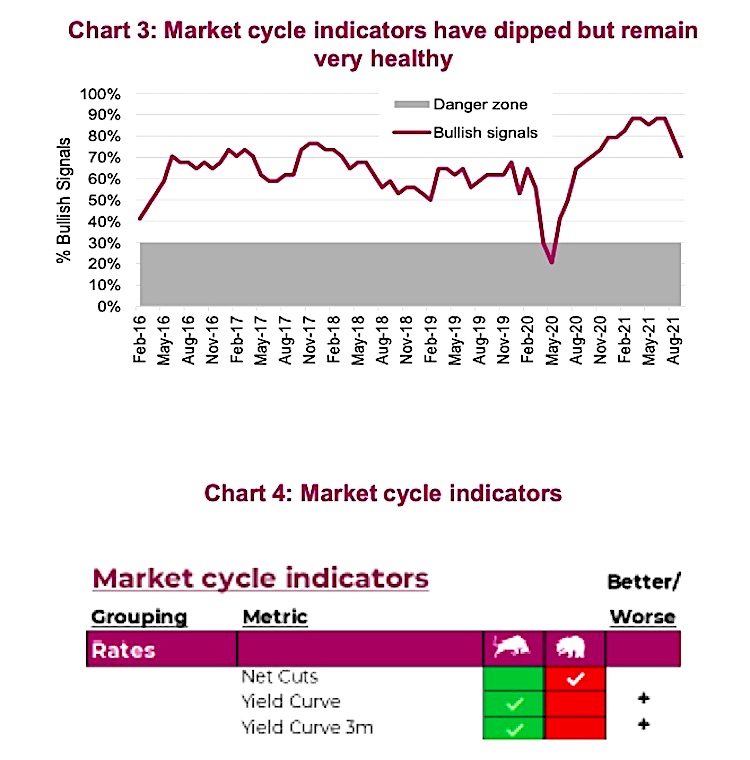
The Market Cycle framework is a multi-factor, multi-discipline approach that attempts to answer the BIG question – is a recession on the horizon (see chart 3). The framework uses a basket of economic, fundamental and yield/credit indicators that have historically been good recession predictors. Complicating matters, every recession is different and as a result some indicators work in some cycles and others in different cycles. There is no one magic indicator. We believe that combining a diversified basket of indicators offers investors a non-emotional lens to gauge if recession risks are elevated or dormant. This also helps to guide asset allocation decisions in calm markets and during periods of market weakness.
Markets hit some volatility
Equity markets have once again experienced some weakness during September, a seasonally volatile month. And while markets are down a bit, the standard question during any period of weakness is whether this is the start of something worse or a potential buying opportunity. Good timing for sharing our Market Cycle framework, whether you are already a follower, or new to this concept.
We categorize our market cycle indicators into four broad categories, Rates, the U.S. Economy, the Global Economy and Fundamentals.
Rates (chart 4) incorporate the activity of central banks around the world, whether tightening or loosening monetary policy. It also incorporates the slope of the yield curve and its changing shape. At the moment, some central banks have started to tighten (a negative), however the yield curve has steepened of late with the uptick in yields (a positive).
The U.S. economy has the most signals which are further broken down into broader economic signals, manufacturing and housing.
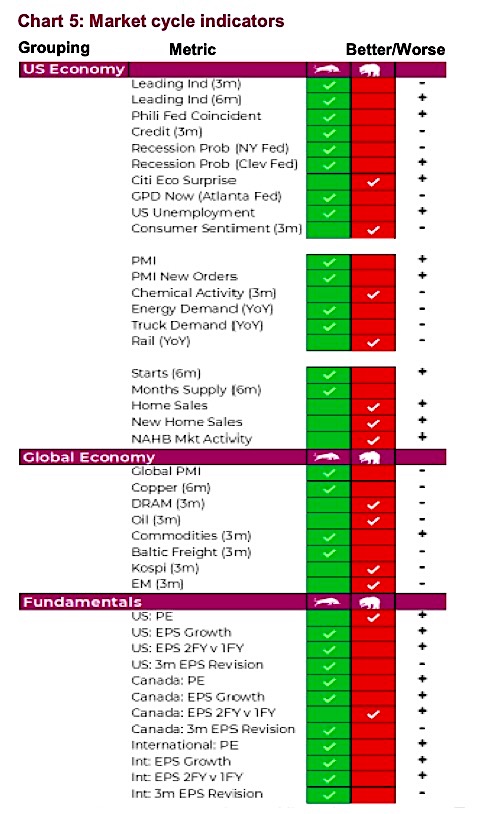
Just about every recession in the U.S. can be traced back to weakness in either housing or manufacturing, given the size of the industries and their cyclicality. Broadly speaking, the U.S. economy remains in good shape (many more bullish signals than bearish). However, signals were stronger a few months back as some weakness has surfaced, mainly in housing.
The global economy has seen more deterioration of late and is now evenly split with four bullish vs four bearish signals. Further evidence is in the trend from last month which saw six deteriorate versus only two improving. A slowdown in China is having a broader impact on the global economy, as is the recent delta variant wave.
Finishing on a positive note, fundamentals remain encouraging. All signals are bullish except valuations in the U.S. and slowing earnings growth. International shows the best with all bullish signals and the majority of improvements over last month.
We have shared all the indicators, their current positioning and whether they improved or deteriorated over the past month. While each signal is not equal, for simplicity and to garner some insights into the trend, we track the percentage bullish versus bearish over time.
The good news is that while the percentage bullish signals have dipped from very elevated levels, they remain well above what we call the danger zone. Historically, when bullish signals have dropped down below about 30%, there is often a recession that has started or is on the horizon. As a result, if this period of market continues and the bullish signals remain healthy, this could be a buying opportunity.
If a buying opportunity arises, the next question is how far will markets pull back. For that we turn to shorter-term sentiment and technical insights.
Source: Charts are sourced to Bloomberg L.P., Purpose Investments Inc., and Richardson Wealth unless otherwise noted.
Twitter: @ConnectedWealth
Any opinions expressed herein are solely those of the authors, and do not in any way represent the views or opinions of any other person or entity.


 Testing Important Price Support")
")
