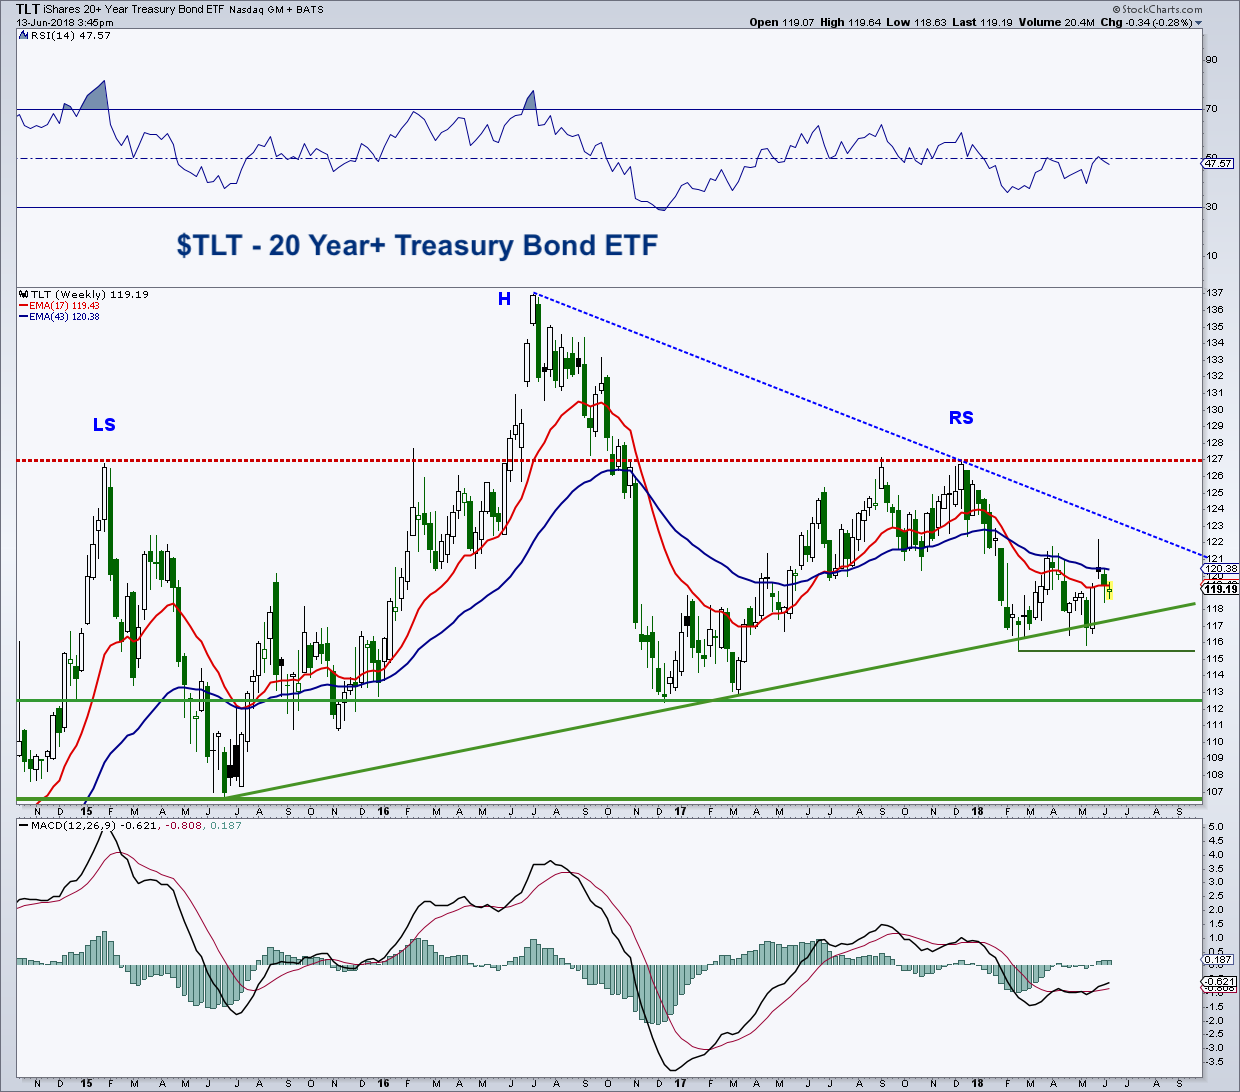
Looking at the weekly chart of the iShares 20+ Year Treasury Bond (TLT), we are seeing price trying to breakout from a potential double bottom.
A close over 121.09 will complete this bullish pattern and target the 128 region.
Before that happens, trend line resistance, off the 2016 peak near 123 must also be taken out.
As I have been saying, I think higher rates are coming, but I do not think this will occur until later this year.
Until then, with sentiment very bearish, and the COT data very bullish, prices should continue higher and yields lower at least in the short- to intermediate term. The broader head and shoulders pattern should also remain on your radar, especially in light of a possible long-term topping pattern.
In my opinion, odds are favoring an upside move over the near-term (as outlined above). However, traders will need to wait for a move over resistance (bullish) or alternatively down through support (bearish) before having conviction on the next directional move.
$TLT – 20+ Year Treasury Bond ETF (Weekly Chart)
Feel free to reach out to me at arbetermark@gmail.com for inquiries about my newsletter “On The Mark”. Thanks for reading.
Twitter: @MarkArbeter
The author may have a position in mentioned securities at the time of publication. Any opinions expressed herein are solely those of the author, and do not in any way represent the views or opinions of any other person or entity.


