10-Year US Treasury Yield Inverted “monthly” Chart
If treasury bonds aren’t on your radar, they should be. Many investors and mom and pops own treasury bonds, whether it be a retirement account or pension.
Last month, I wrote an article about the potential for a reversal on the 30-Year US Treasury Bond by looking at an inverted chart of the 30-Year Treasury Bond Yield.
Today, I do the same thing but with the 10-Year US Treasury Bond Yield. For one, bonds and bond yields are an inverse relationship. And two, inverting charts can offer a creative (and unbiased) way of analyzing where one thinks price is headed next.
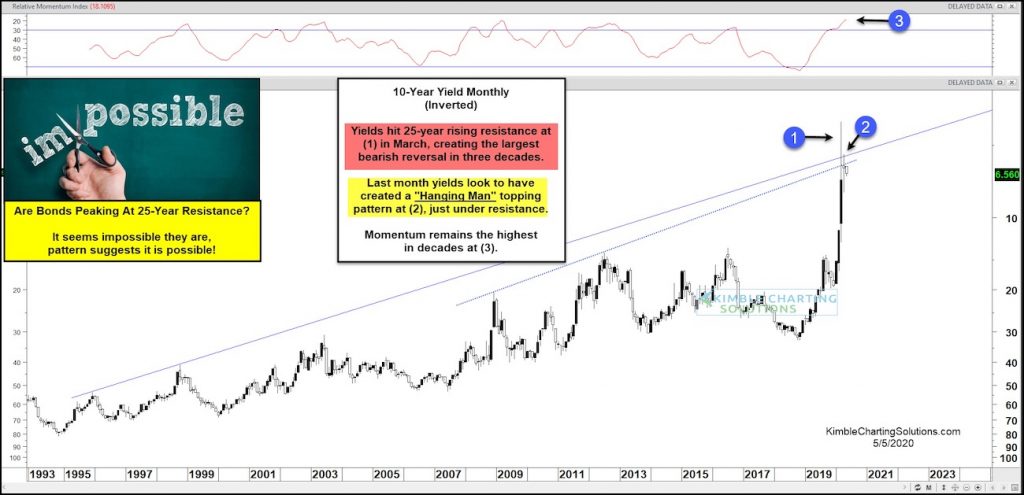
In this case, we can see that the inverted 10-Year Bond Yield appears to be putting in a long-term massive bearish “monthly” reversal. This started in March with the largest reversal in 3 decades at (1).
And last month followed with a “hanging man” topping candle at 25-year price resistance at (2). Note that this resistance is fortified by two converging trend lines.
Finally, momentum remains at the highest level in decades (3).
Taken together, this is a historic bearish reversal for Treasury Bonds. Follow through to the downside would confirm this ominous pattern. Stay tuned!
Note that KimbleCharting is offering a 2 week Free trial to See It Market readers. Just send me an email to services@kimblechartingsolutions.com for details to get set up.
Twitter: @KimbleCharting
Any opinions expressed herein are solely those of the author, and do not in any way represent the views or opinions of any other person or entity.
: Creating Bullish Divergence?")


: Creating Bullish Divergence?")