The mid-cap segment of the equity market (NYSEARCA:MDY) may be offering bulls the best set-up at the present time.
If Goldilocks was an equity trader, she would probably have her eye on the mid-cap segment of the market right now – that is, if she was a technician. We say that because among the various market cap options, mid-caps appear to be in the sweet spot right now, from a charting perspective.
Following an impressive run up to new highs, small-caps ran into some key extension levels and, like papa bear’s porridge, appear to be just a little too hot to chase at the moment.
Conversely, as we tend to favor high relative strength areas of the market, the lagging large-caps just don’t fit the bill either. They remain stuck in a trading range and well off of January’s highs. Therefore, they’re a bit too cool for our liking.
Mid-caps, however, may be just right.
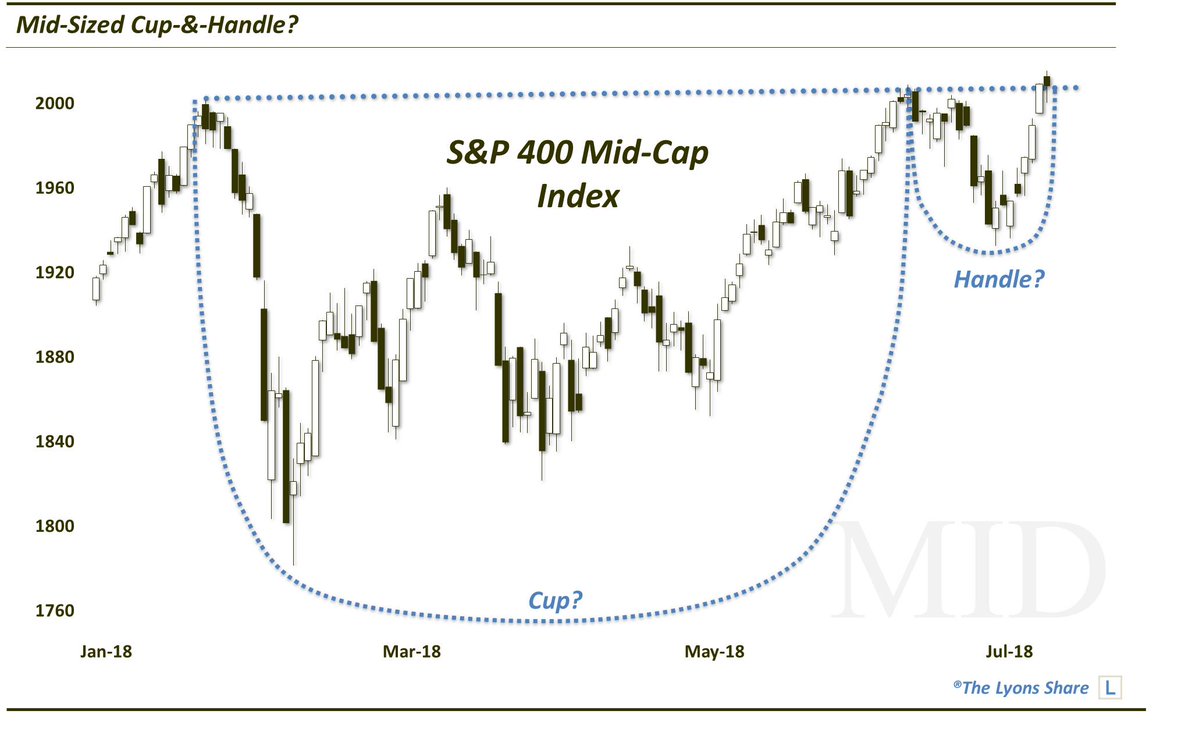
That’s because mid-caps, as represented by the S&P 400 Mid-Cap Index – $MID (INDEXSP:SP400), have demonstrated relative strength of late, bouncing solidly this past week back up near their all-time highs. Plus, as they have not yet broken out and extended themselves into new high ground, they appear to have fuel in their tank still to initiate such a run.
And the kicker is, they have potentially formed a cup-&-handle pattern on their chart over the past 6 months.
As a refresher, the “cup-&-handle” is historically a pattern with very bullish implications. It involves 2 parts, generally showing the following characteristics:
The Cup: This phase includes an initial high on the left side of a chart (e.g., the January high in MID around 2000), followed by a relatively long, often-rounded retrenchment before a return (e.g., June) to the initial high.
The Handle: This phase involves a shorter, shallower dip in the stock and subsequent recovery to the prior highs (e.g., the June-July stint in MID).
The bullish theory is predicated on the idea that after taking a long time for a stock to return to its initial high during the “cup” phase, the “handle” phase is much briefer and shallower. This theoretically indicates an increased eagerness on the part of investors to buy the stock since they did not allow it to pull back nearly as long or as deep as occurred in the cup phase. Regardless of the theory, the chart pattern has often been effective in forecasting an eventual breakout and advance above the former highs.
Whether or not the bullish implications play out remains to be seen. But versus a too-hot small-cap segment and cool large-cap space, the setup in mid-caps may be “just right”.
In a Premium Post at The Lyons Share, we look at the best way – and the best spot – to take advantage of this opportunity.
Twitter: @JLyonsFundMgmt
The author may have a position in mentioned securities at the time of publication. Any opinions expressed herein are solely those of the author, and do not in any way represent the views or opinions of any other person or entity.


