We talk a lot about the importance of watching the performance of market leading stocks and sectors. And just last week we highlighted that the Semiconductor Sector (SMH) was nearing its 38.2% Fibonacci level.
Well, that level is already showing its importance and has given the rally pause. Could it lead to a pullback or another strong move lower?
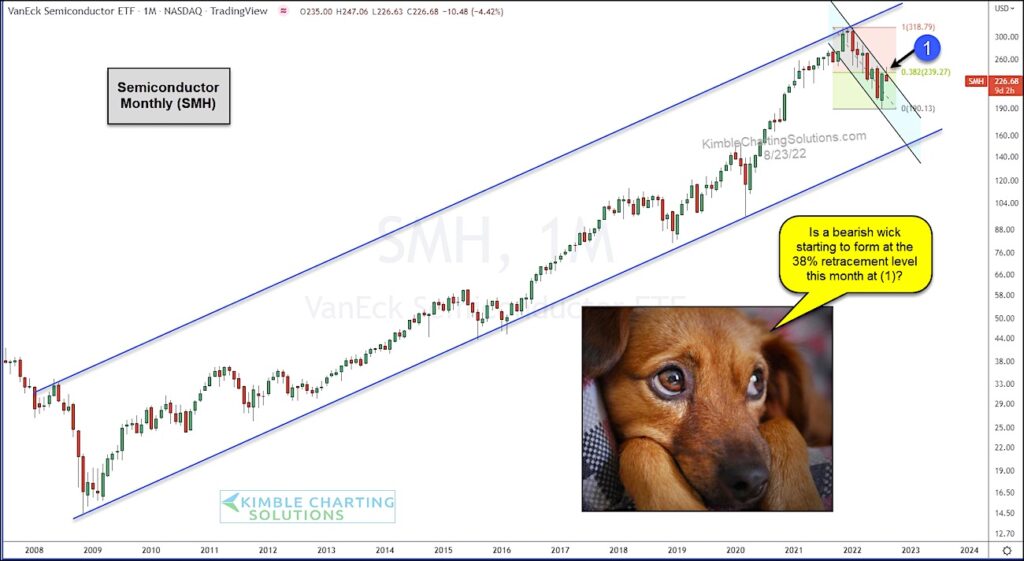
Today’s chart is a long-term “monthly” chart of $SMH, the Semiconductor Sector ETF. This market leader has out-performed for the majority of the rally from the 2009 low. But it also peaked and lead the market lower at the end of 2021 and into 2022. So it is an important one to watch.
Currently, SMH is attempting to put in a bearish reversal for the August price candle. And this comes from none other than the 38.2% Fibonacci level. In my humble opinion, investors should keep an eye on how SMH finishes out the month.
Could leadership be creating a monthly bearish reversal at a key Fibonacci level this month? Stay tuned!
$SMH Semiconductor Sector “monthly” Chart
Note that KimbleCharting is offering a 2 week Free trial to See It Market readers. Just send me an email to services@kimblechartingsolutions.com for details to get set up.
Twitter: @KimbleCharting
Any opinions expressed herein are solely those of the author, and do not in any way represent the views or opinions of any other person or entity.

: Showing Some Signs of Emerging Strength")
