Make no mistake about it, Semiconductors are an important leader within the technology sector. They lead the market higher… and lower.
This year’s bear market is a great example as the Semiconductor Sector (SMH) began underperforming in late 2021 and lead the market lower into 2022.
But tech stocks are bouncing… and SMH is attempting to head even higher yet.
So today we look at a long-term “monthly” chart of SMH to highlight a key price point that may decide if this rally has legs.
Is the recent bounce the start of a new bull leg higher or a rally in a bear market?
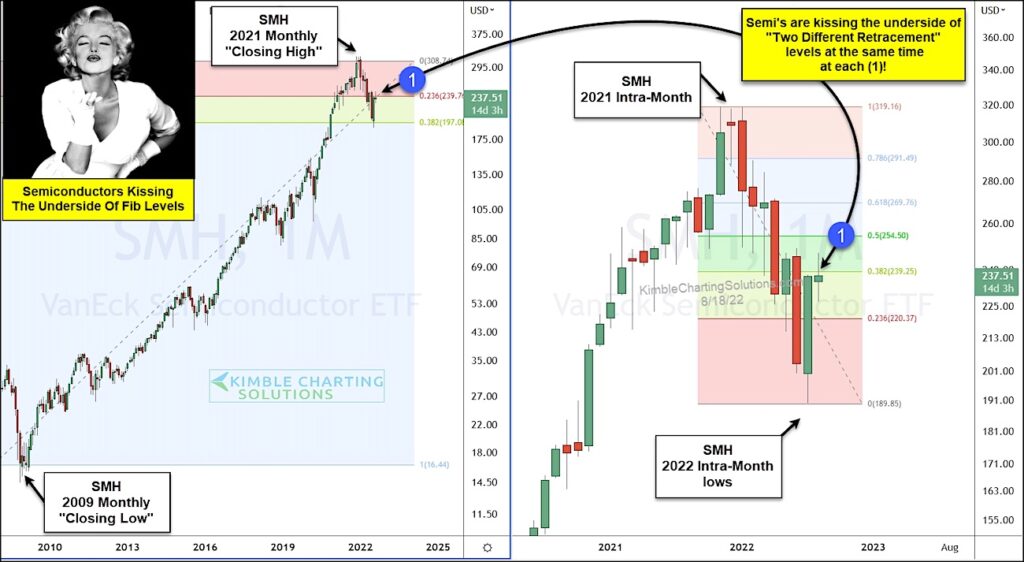
Perhaps this dual Fibonacci retracement level with tip investors off. As you can see, the Semiconductors ETF (SMH) declined to about the 38.2% retracement (of the 2009 low to 2021 high) and has rallied back to the 23.6% level. At the same time, it is testing the 38.2% retracement of the 2021 high to 2022 low. These are occurring at the same time at each point (1).
SMH might resolve the debate of new bull or bear market bounce by what it does from here. Stay tuned!
$SMH Semiconductors ETF “monthly” Chart
Note that KimbleCharting is offering a 2 week Free trial to See It Market readers. Just send me an email to services@kimblechartingsolutions.com for details to get set up.
Twitter: @KimbleCharting
Any opinions expressed herein are solely those of the author, and do not in any way represent the views or opinions of any other person or entity.
")


")
