The precious metals arena has reached important junctures for both Silver and gold. Yesterday, we highlighted an important test of support for Silver.
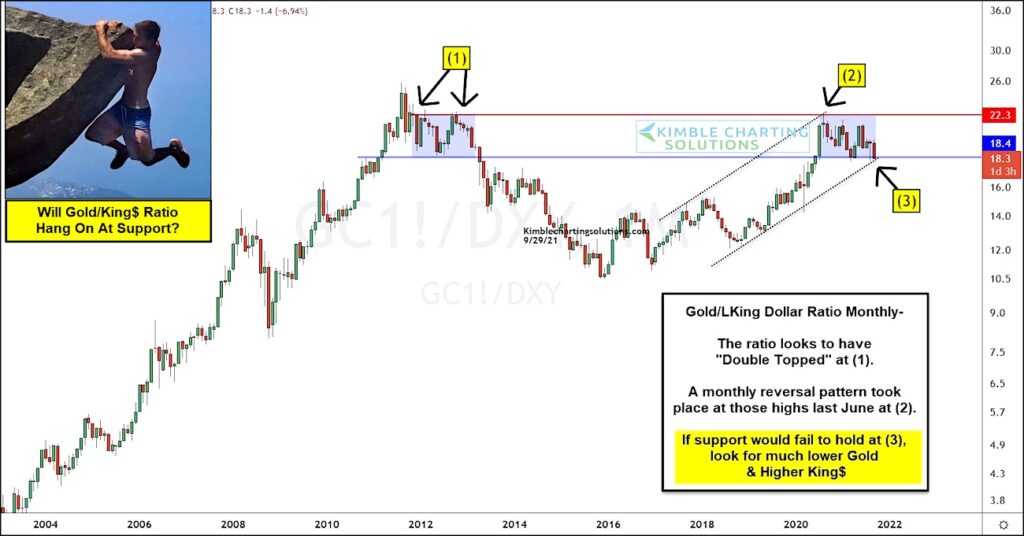
Today, we look at a “monthly” chart of the Gold / US Dollar Ratio and highlight a similar test of support.
As you can see, this important ratio for precious metals bulls looks to have double topped at (1). As well, a monthly bearish reversal pattern took place at those highs last June at (2).
2013 Deja Vu For Gold / King Dollar Ratio?
After the bearish reversal, the Gold/US Dollar ratio made a low early this year and headed higher. But it failed to make new highs (creating a lower high) and headed lower once more.
Now the ratio is testing important support at this year’s low, marked by (3)… this is also the same support area that gave way back in 2013 leading to a plunge in the price of Gold.
Gold looks to be hanging by a thread at (3). If support breaks, look out!
Note that KimbleCharting is offering a 2 week Free trial to See It Market readers. Just send me an email to services@kimblechartingsolutions.com for details to get set up.
Twitter: @KimbleCharting
Any opinions expressed herein are solely those of the author, and do not in any way represent the views or opinions of any other person or entity.


")

