Recent leader, the MSCI Emerging Markets Index (INDEXNYSEGIS:EMX), is hitting a major confluence of resistance at the moment.
One theme we’ve been all over in 2017 is the good relative performance of international markets. That includes emerging markets, individually and collectively, as measured by the MSCI Emerging Markets Index (EM).
EM is up some 17% this year already. But unlike many of the international standouts of 2017, EM fared extremely well in 2016 as well. In fact, since its early 2016 low, EM is up nearly 50%.
Of course, EM was badly beaten down over nearly a decade prior, in particular, since 2011. So some of this rally was certainly “overdue”. However, the concern is that, at some point, the potential resistance posed by nearly a decade of overhead supply (prices) will be a factor. That point is now.
We have been pointing out in our Daily Videos that while the EM was in a nice uptrend, it was approaching a confluence of serious potential resistance on its chart, near the 1015 level. It closed yesterday at 1015.05, so it is there. What is the serious resistance? Here is the chart:
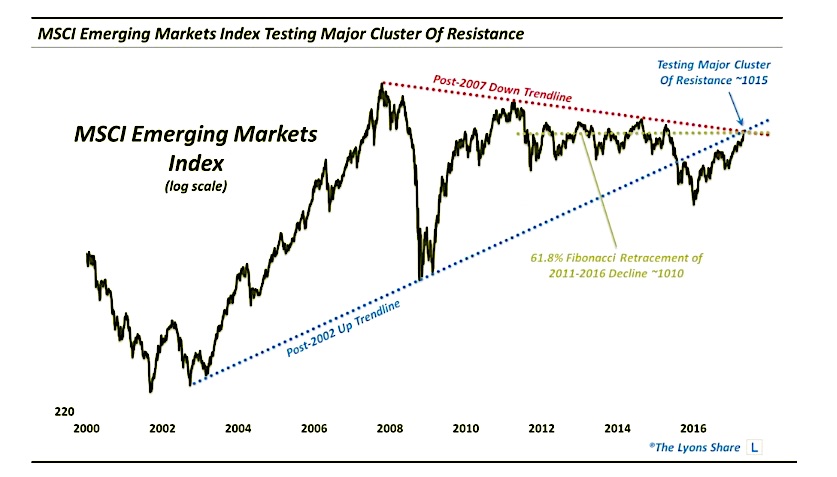
Specifically, the cluster includes a trio of key potential resistance points intersecting near the 1015 level:
- The underside of the broken Post-2002 Up trendline that connected the 2008 lows
- The Post-2007 Down Trendline that connected the peaks in 2011, 2014 and 2015
- The 61.8% Fibonacci Retracement of the 2011-2016 Decline
So what do we expect to transpire here? Our view is that this is serious resistance that carries a very strong chance of holding down EM prices for at least the intermediate-term. We do think there is also a strong chance that EM has bottomed for the cycle and has begun a new cyclical leg of advance. However, such an advance will not come in a straight line (notwithstanding EM’s performance of the past 15 months).
Thus, our inclination is to take considerable profits in any broad emerging markets exposure at this time (individual EM markets may be taken on a case-by-case basis). Should this 1015 level be decisively taken out, we can revisit adding exposure. More than likely, however, we envision adding exposure into a healthy pullback. At this point, the best support below looks to be around the 940 level, and the 885 level below there.
Get more charts and insights over at our new site, The Lyons Share. Thanks for reading.
Twitter: @JLyonsFundMgmt
The author may have a position in mentioned securities at the time of publication. Any opinions expressed herein are solely those of the author, and do not in any way represent the views or opinions of any other person or entity.


