Today we look at why g n’ r are rocking the markets. No, this is not an homage to Axl and Slash, but we will do our best to work ‘Welcome to the Jungle’ into this financial market update.
Instead, we are talking about little ‘g’ and little ‘r’ – two of the most important inputs for market valuations. In fact, little ‘g’ n’ little ‘r’ are so powerful, they could even justify current market valuations and provide a cautionary cue for the coming quarters.
But first, when it comes to valuations for the market, price-to-earnings ratio (PE) is certainly the more common measure.
PE is a quick and easy gauge for valuation, especially in contrast with historical levels. For example, the S&P 500 collectively trades at 21x earnings. That is high based on the long-term historical average of 16x, but this is lazy math. Price divided by earnings, whether trailing or estimates for the next 12 months, hardly encapsulates the value of a company or market. It ignores earnings growth and growth rates, variability in those earnings, leverage, or returns available in competing investments, among other things. We don’t imply investors should ignore PE ratios, but it is merely one input.
More serious valuation approaches are often built around the time value of money, a very prevalent methodology in the bond market. The names of these models include discounted cash flow or dividend discount models. Essentially, they attempt to value something in today’s dollars – a company, an index, a bond – based on the cash flows, dividends or earnings for many years into the future, discounted to adjust for time and risk. While the formulas differ, the following is a loose generalization that will suffice for us:
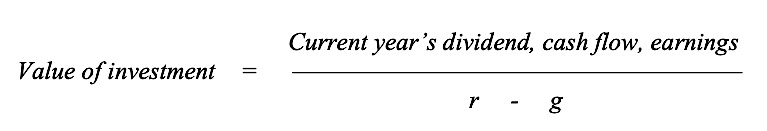
The ‘r’ is influenced by the variability of the investment’s future growth rate. If less certain about ‘g’ or the future, then ‘r’ is bigger. Benchmark returns or rates, such as the risk-free rate or yield on government bonds, influence ‘r’. Inflation impacts ‘r’. If inflation is higher than the future earnings, they must be discounted at a higher rate. The ‘r’ tries to capture many of the risks and uncertainties of the future earnings, dividends or cash flows.
Rising ‘g’ & smaller ‘r’: A great combo for markets
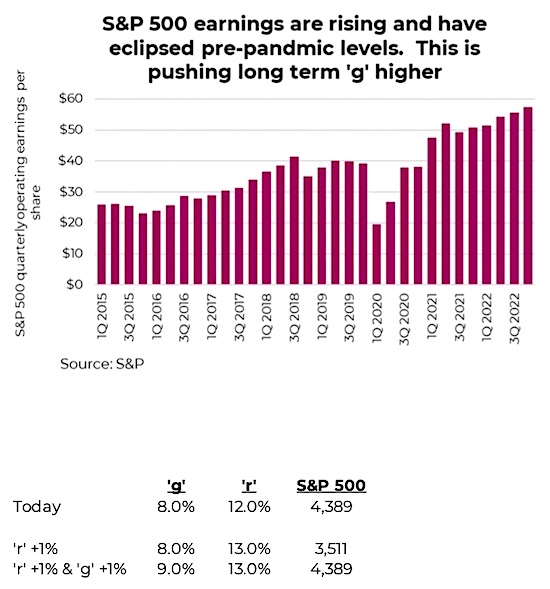
If ‘g’ gets bigger, the value of the investment goes up. Logically, cash flow or faster growing earnings is clearly good. During the past year and a half, this is precisely what has been happening, contributing to the markets’ push higher. It does not take a professional tea leaf reader to see that earnings have come roaring back, exceeding expectations in a meaningful way. Clearly the re-opening of the economy has been a huge tailwind for earnings, as has fiscal and monetary stimulus to help it along. Companies have also pivoted and adjusted really well, in aggregate, to this ever-changing environment. The degree of this earnings growth is breathtaking. Assuming forecasts for Q3 and Q4 earnings hold, 2021 will come in at about $199 for the S&P 500. The previous peak in calendar earnings was $157 in 2019 and only broke the $100 level in 2013. This rapid earnings growth has nudged the long-term ‘g’ higher.
The little ‘g’ and little ‘r’ in the denominator of the equation have a huge impact on the value of the investment. The ‘g’ is the expected long-term or perpetual annual growth rate of the dividend, cash flow, or earnings from the top numerator of the equation. Of course, who knows what the future holds? For a company we can probably have a reasonable idea on earnings for a year or two … but in 2030? Plus, $1 of earnings or dividends in 2030 is certainly worth less than $1 in 2021. The ‘r’ discounts those future earnings.
At the same time, ‘r’ has become smaller. The biggest reduction in ‘r’ has likely come from the declining uncertainty around the impact of the pandemic. Less risk equals a lower ‘r’.
And if ‘r’ gets driven lower by any combination of less future uncertainty, lower interest rates, or less inflation, the value of the investment goes up. This combination is precisely what has happened to the equity markets over the past year and a half; a rising ‘g’ and a falling ‘r’, driving the value of the investment higher.
Some more fun with math. Let’s say ‘g’ is the median long-term yearly growth rate in earnings for the S&P 500, which is about 8% over the past eighty years. This is not an unreasonable assumption given economic growth is starting to normalize, and this will likely bring earnings growth back closer to the long-term trend. With the trailing earnings of the S&P 500 of $175, this equates to an ‘r’ of about 12%. The ‘r’ includes many components, including future uncertainty, the risk-free rate, inflation and yields.
What if the combination of inflation and rising yields lifts the long term ‘r’ from 12% to 13%? If nothing else changes, the S&P becomes 3,511. Don’t panic, this isn’t a forecast, but it does highlight the sensitivity of the current market to changes in things such as the long run inflation rate and yields. Fortunately, higher inflation and yields may lift ‘g’ a bit higher (earnings get inflated too), helping offset the negative impact of a higher ‘r’. Certain markets benefit more from this natural offset, like those with a greater weight to companies that benefit from inflation or rising yields – the TSX for example.
Investment implications
The markets over the past 18 months have really benefited from a rising ‘g’ and a falling ‘r’ – a very powerful combination. While all markets have benefited, some have lifted more than others. Those equity markets that are longer duration or growth tilted, are more sensitive to both ‘g’ and ‘r’ and have rallied more (S&P 500, NASDAQ). Those markets that are more cyclical or value tilted have proven less sensitive (TSX, Europe). Yet another reason to consider adding to TSX or international equity weight at the expense of U.S. equity.
Now, if you are in our camp and agree the economic recovery is losing momentum and normalizing at the same time yields are trending upwards due to a combination of less fiscal/monetary support and inflation pressures, the trend in both ‘g’ and ‘r’ may be poised to change from tailwinds to headwinds. ‘Welcome to the Jungle’ does not seem appropriate; perhaps ‘November Rain’.
Source: Charts are sourced to Bloomberg L.P., Purpose Investments Inc., and Richardson Wealth unless otherwise noted.
Twitter: @ConnectedWealth
Any opinions expressed herein are solely those of the authors, and do not in any way represent the views or opinions of any other person or entity.

: Showing Some Signs of Emerging Strength")
