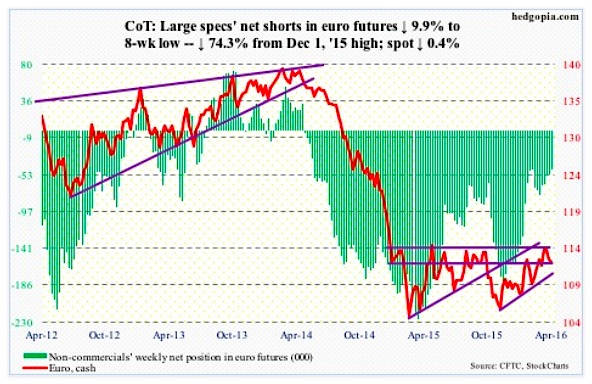
Euro: Resistance at 114-114.50, which goes back to January last year, has held – at least so far. After unsuccessfully trying to break out for three consecutive weeks, the euro once again had a feeble shot at that ceiling this week, but to no avail.
The European Central Bank’s governing council meeting this week, or Mario Draghi, ECB president, for that matter, was no help.
The deposit rate on lenders’ reserves parked at the central bank was kept at minus 0.4 percent. Mr. Draghi’s oft-repeated ‘all policy tools remain on the table’ did not excite the markets.
Post-meeting on Thursday, the euro at one point was up 0.9 percent to 113.97 before giving back the gains and falling back to 112.86, down 0.1 percent for the session. Come Friday, it shed another 0.5 percent.
Weekly indicators seem to be rolling over, with plenty of room for the currency to drop. The 50-day moving average (111.9) is flattening/dropping slightly.
April 22 COT Report Data: Currently net short 46.9k, down 5.1k.
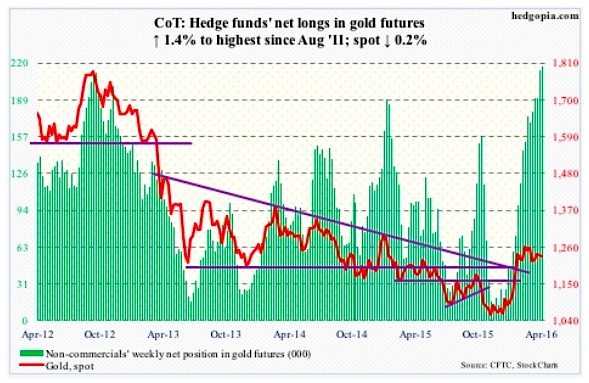
Gold: Kudos to gold bugs for negating a fortnight ago a budding descending triangle pattern on spot gold. Concurrently, the 50-day moving average was defended as well. As a matter of fact, since April 1st, the metal has pretty much followed the average higher. That changed Friday, when the spot lost 1.3 percent, and the 50-day as well.
On Thursday, it rallied all the way up to 1272.4 before closing at 1249.5, producing a not-so-good-looking candle. The Thursday high approximated the top end of the range it is in.
As far as flows go, GLD, the SPDR gold ETF, lost $206.8 million in the week ended Wednesday. This comes on the heels of $381 million in outflows in the prior week.
That said, non-commercials continue to exude confidence, with net longs rising to the highest since August 2011. The problem is, gold has lost ground in the past couple of weeks – although ever so slightly.
April 22 COT Report Data: Currently net long 216.8k, up 3k.
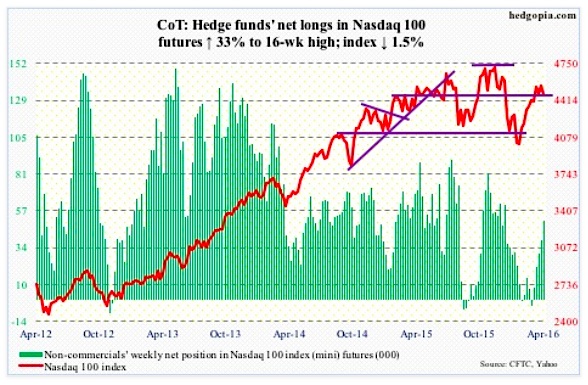
Nasdaq 100 Index (mini): In the six sessions through Thursday, there were three doji sessions on the Nasdaq 100, essentially hugging the 10-day moving average. That got taken out Friday, reacting to disappointing earnings from Alphabet (GOOGL) and Microsoft (MSFT), among others; the session, down 1.5 percent, produced another long-legged doji.
The good thing is, until Friday the index was holding up just fine despite $643.1 million coming out of QQQ, the PowerShares Nasdaq 1000 ETF, in the week ended Wednesday.
There are tons of support underneath, with the 200-day moving average at 4423 and the 50-day at 4369. The latter also approximates horizontal support at 4350 going back to November 2014.
April 22 COT Report Data: Currently net long 50.5k, up 12.4k.
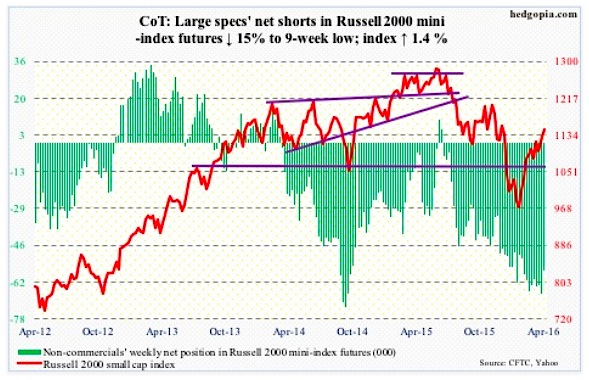
Russell 2000 mini-Index: After remaining right underneath the 200-day moving average for three straight sessions last week, the Russell 2000 broke out of it on Monday. Interestingly, the index was also able to feebly break out of a declining trend line from last June. Flows helped.
IWM, the iShares Russell 2000 ETF, attracted $240.4 million in the week ended Wednesday (courtesy of ETF.com). A convincing break out of this trend line would be a major win for the bulls, but it is anything but – particularly so considering how overbought conditions are.
April 22 COT Report Data: Currently net short 56.8k, down 10k.
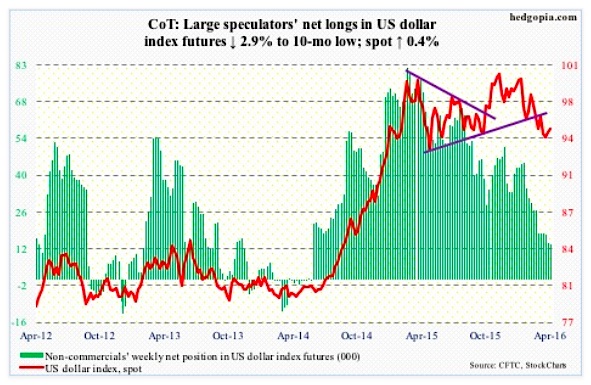
US Dollar Index: Since the dollar index reached an eight-month low of 93.62 on April 12th, it essentially went sideways, enabling shorter-term moving averages to flatten out. Then a Thursday hammer set up a 0.5-percent rally on Friday.
The weekly chart is itching to move higher. Overhead resistance is strong – particularly around 97, which is where the 200-day moving average lies as well (97). The 50-day moving average (95.9) is beginning to go flat.
It will be interesting to see if action on Wednesday through Friday tempted non-commercials to add to net longs. As of Tuesday, holdings were at a 10-month low.
April 22 COT Report Data: Currently net long 13.4k, down 400.
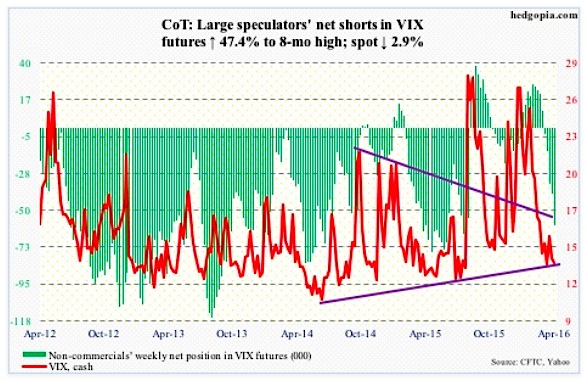
VIX: On Wednesday, for the first time since October 28th, spot VIX dropped below 13. Both were hammer sessions and both tagged the lower Bollinger Band. Back then, VIX went on to quickly rally to north of 20 in the next 13 sessions. The odds of a similar performance by VIX this time around? Pretty good. VIX remains oversold – now on a weekly chart as well.
Similarly, in four of the past six weeks, the VIX-to-VXV ratio has been sub-0.80, with the March 14th week producing a reading of 0.782 – a one-year low. The other two weeks are in the low 0.80s. This is too low a reading for too long a duration.
April 22 COT Report Data: Currently net short 59.4k, up 19.1k.
Thanks for reading.
Twitter: @hedgopia
Read more from Paban on his blog.
The author may hold positions in mentioned securities at the time of publication. Any opinions expressed herein are solely those of the author, and do not in any way represent the views or opinions of any other person or entity.


