Back in mid-August, I discussed why Apple (NASDAQ:AAPL) may be nearing a top. I offered a big picture look at Apple’s chart along with key patterns in play.
Time for an update…
Since that post, shares of Apple (AAPL) have fallen roughly 9% and on Friday AAPL stock price found support at a very important PATTERN based level.
As many of you know, my work is all about vibrations, music and math. I have no earthly idea about the fundamentals of the new iPhone, AAPL’s latest earnings call or any analyst stuff. Just the numbers …
And here they are:
- Note the daily hammer the lower range of the gap that was formed in early August.
- .618/.786 Fibonacci retracement levels
- 1.4142 extension (square root of 2)
- Dashed red line measured move correction
- Precise Square Root target on top of all the other levels mentioned above.
Apple Stock Chart – Time For A Bounce?
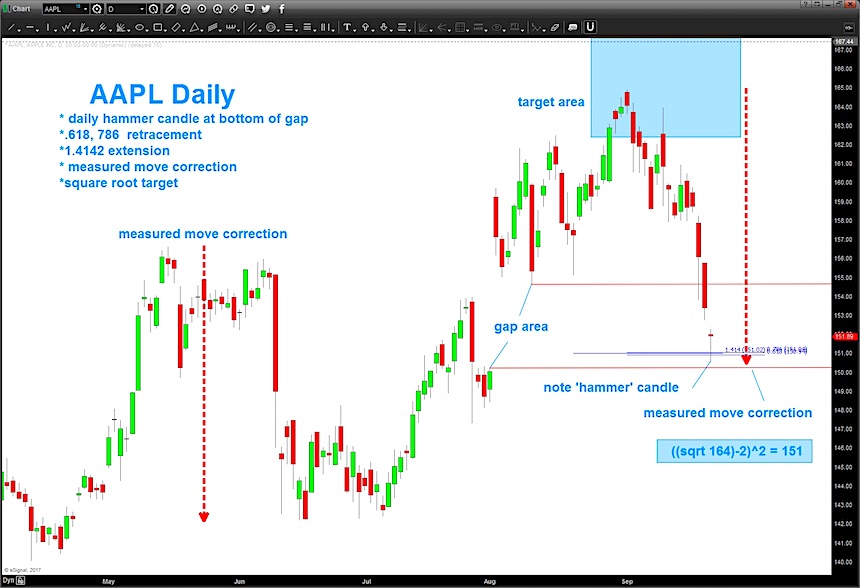
Over the coming days/weeks this $151 support should hold if the bull trend is ongoing. Also, note, the ‘target area’ for this stock went all the way up to 170 so it’s not inconceivable for one more move higher. Based on all the above, consider $151 a very important level for now.
Twitter: @BartsCharts
Author does not have a position in mentioned securities at the time of publication. Any opinions expressed herein are solely those of the author, and do not in any way represent the views or opinions of any other person or entity.
ALSO READ: Is Apple’s Stock (AAPL) Nearing A Major Top?


: Showing Some Signs of Emerging Strength")
