 By Andrew Nyquist Back on March 9, I wrote a blog about the possibilities for at least an Apple stock (AAPL) bounce, focusing on the long-term uptrend support line around $420 to $425. Considering that technicians and trend watchers tend to be watching the latest trends in terms of daily bars (over the past few months or year or two), this was a monthly bar chart over the past 10 years. So this support had important implications, especially at a time when sentiment was extreme. That said, here we are; over two weeks later, the stock is up around $470 (as of early morning, March 25), and the AAPL rally is on. So let’s look at the AAPL rally and focus on some near-term AAPL resistance levels (targets, magnets, etc).
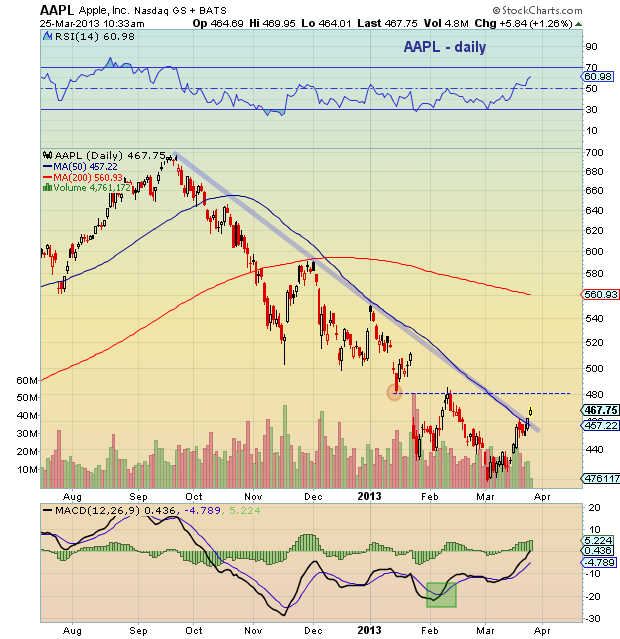
The most important resistance level for the AAPL rally has been taken out: the downtrend line. This is an important sign of strength, and often indicates a change in trend (at least near-term); the only caveat being: as long as AAPL can stay above $455-$460. See break out chart below.
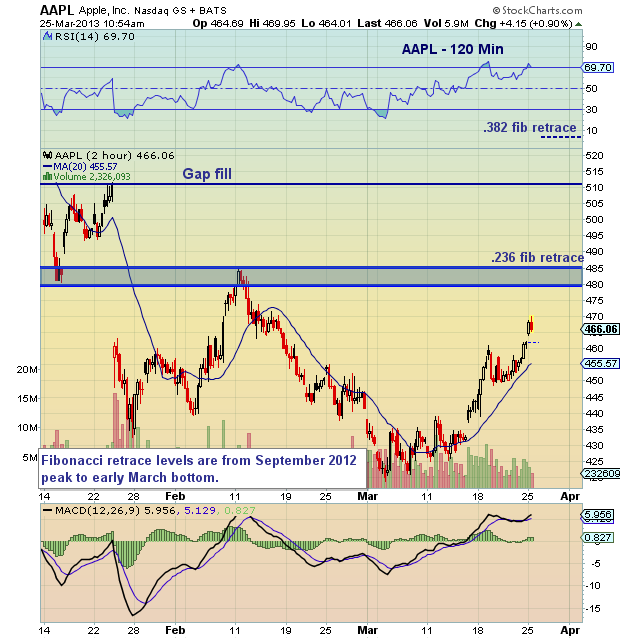
Now that the Apple’s stock price is looking up, let’s look at what’s next. For me, I look for levels that could be important price magnets for the AAPL rally going forward. This could be breakdown areas (gaps lower), clusters of price action (resistance), or important fibonacci levels. The first important overhead resistance appears to come in around $478-$483. This marks the January lows vs the February highs confluence. Note that $486 is the .236 fibonacci retrace of the fall from Apple’s peak stock price. So this area could be cause for a pause… possibly a reason to retest the breakout area. Note, though, that much of the near-term action will hinge on quarter end and any spillover into early April.
Not to get ahead of ourselves, but above this band of resistance, comes gap fill around $510 and the .382 fibonacci retracement level at $528.
Trade safe, trade disciplined.
Twitter: @andrewnyquist and @seeitmarket
No position in any of the mentioned securities at the time of publication.


