 It seems that the Apple (AAPL) chatter is finally dying down a bit. But really, right here and now, AAPL is testing a key support area: its long-term trend line. Now, there isn’t any need for a long, over-exhaustive puke your brains out analysis here; just a quick update of the AAPL long term chart. But investors should take note.
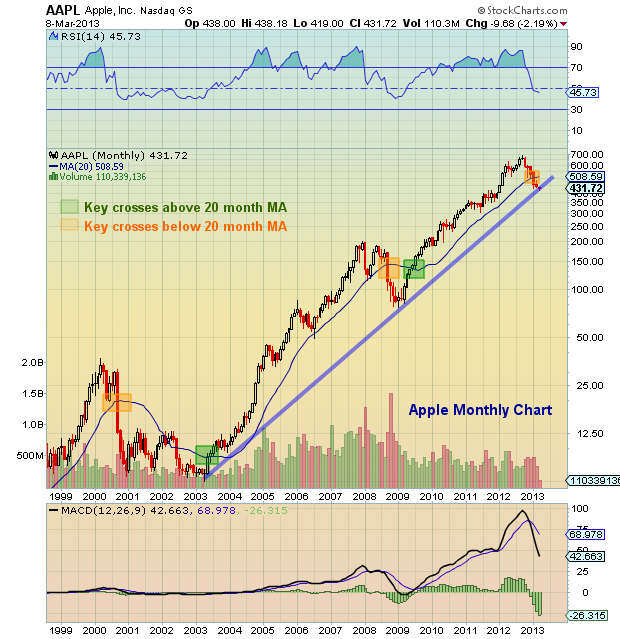
Below is a 15 year chart with monthly bars, so this is 5,000 ft view of the stock. And considering this, one has to use a pretty “thick” crayon with the trend line (due to intra-month swings). But in general, the $420-$430 level appears to be important for AAPL, especially on a monthly closing basis. A sustained move below its long term trend line would likely be a flush that gets bought for a trade, but leaves the stock technically broken. Note as well the importance of the 20 month MA and how the recent break below this level was key to the deep January “flush” bar.
For more on AAPL stock, read “Apple Stock Worthy of Trade, Wary of an Investment.” Trade safe, trade disciplined.
AAPL Long Term Chart and Trend Line (Monthly):
Twitter: @andrewnyquist and @seeitmarket
No position in any of the mentioned securities at the time of publication.
: Worrisome to Broader Market?")

: Important Breakout Retest")