The real reaction to Wednesday’s Federal Reserve meeting is likely to happen Thursday.
All eyes and ears were on Chairman Jerome Powell today. Most notable was how he and the markets were clearly uncomfortable with the press conference, but it was not until it was finished that the markets all drifted in their respective directions.
Gold higher, stocks lower, bonds bounced, and oil continued its collapse – quietly.
With the exception of crude oil, the moves in the above markets were muted, but clearly directional into the close.
Often times the bigger reaction to the Fed comes the day after the news. Now Thursday will begin with some very volatile looking charts.
The regional banks will undoubtedly get most of the attention on Thursday as they continue to slide on after market news that PacWest Bancorp (PACW) is “looking at strategic options” and its stock is down over 50% in after hours trading.
However, there are two other areas of the markets to pay close attention to.
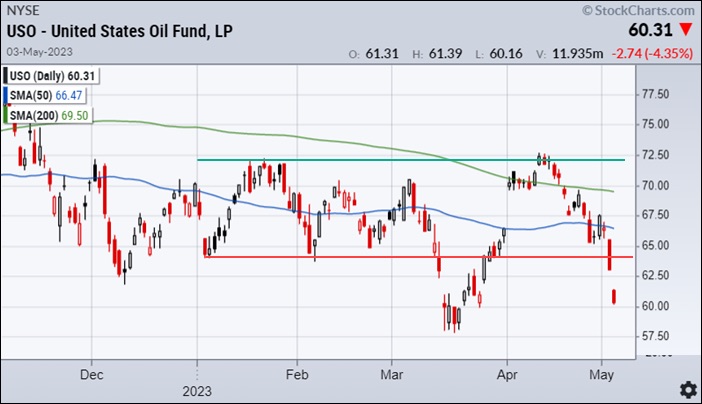
- At MarketGauge we treat the January low as an important psychological level in any market, and USO has a history of experiencing big drops when it trades below this level. If you’re interested in this concept, look at the price action in 2018, 2017, 2015, and 2014 around the January low price level for each respective year.
In addition, to breaking the January low, USO has moved under the 23-month moving average. If you’ve been listening to Mish lately, you’ve undoubtedly heard her explain that breaking this moving average is very bearish.
A collapse in crude prices may help the consumer and inflation, but it will also project a lack of confidence in the strength of the economy and hurt company profits in the energy sector. On balance a big move down will weigh on the general market in the short-term.
I explained why SMH what in a precariously bearish condition. As you can see in the chart below, and since that article, SMH, has broken below its 50-day moving average and then rallied back up to it.
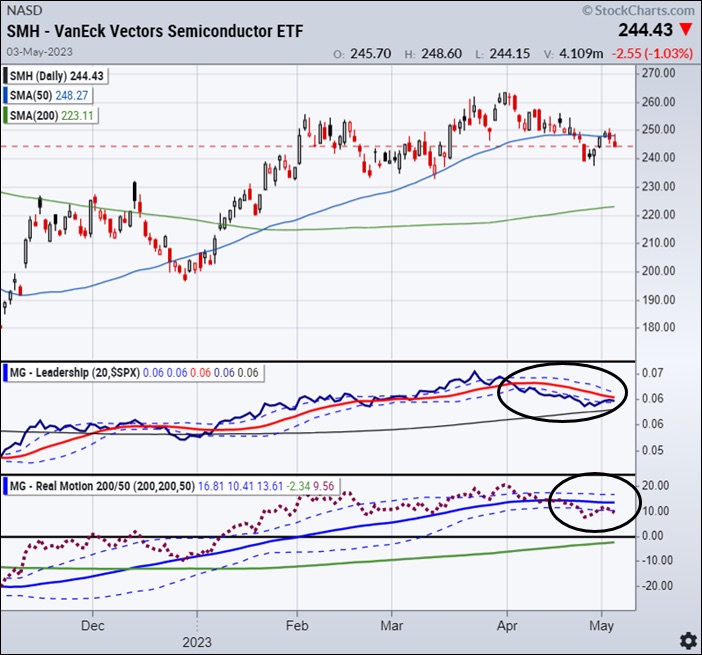
SMH is again in the same very precarious position. The MG Leadership line is bearish (blue line under red) and Real Motion is also confirming the bearish break of the 50-day average.
Historically, the SPY and QQQ have a hard time rallying when SMH is bearish on the MG Leadership indicator. If SMH breaks lower, the price pattern and indicators suggest the breakdown will continue. This would weigh heavily on the general market.
If SMH trades back over $250, this bearish warning will be negated.
Don’t take your eyes off SMH.
Stock Market ETFs Trading Analysis & Summary:
S&P 500 (SPY) 23-month MA 420
Russell 2000 (IWM) 170 support – 180 resistance
Dow (DIA) Over the 23-month MA-only index
Nasdaq (QQQ) 329 the 23-month MA
Regional banks (KRE) 43 now pivotal resistance
Semiconductors (SMH) 246 the 23-month MA
Transportation (IYT) 202-240 biggest range to watch
Biotechnology (IBB) 121-135 range to watch from monthly charts
Retail (XRT) 56-75 trading range to break one way or another
Twitter: @marketminute
The author may have a position in mentioned securities at the time of publication. Any opinions expressed herein are solely those of the author and do not represent the views or opinions of any other person or entity.

: Worrisome to Broader Market?")

