As the market reverses course today, I thought it would be important to post a harmonic pattern on the NASDAQ Composite that I’ve been following: the bearish bat pattern.
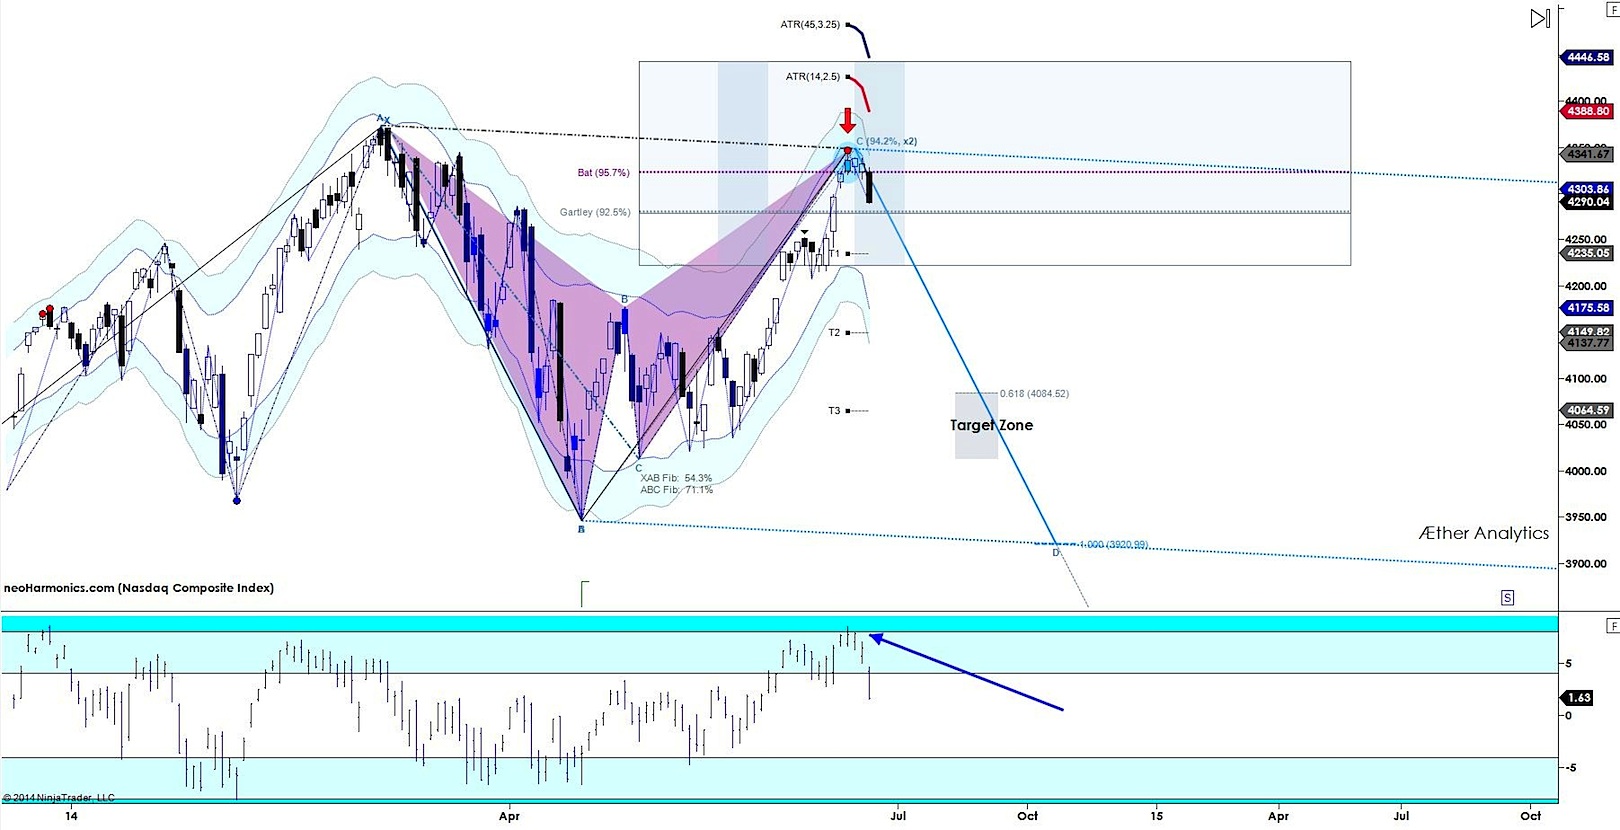
The reason this pattern stands out is its high degree of symmetry in price and in time. Looking at the chart below, we can see that the Bat reversal Zone had a 95.7% accuracy in terms of the 5 points in the pattern.
In addition, the reversal came in line with the time symmetry zone. Additional confirmation comes from a detrended oscillator high at an extreme level; this suggests exhaustion in this market.
Note that measured move targets for bearish bat patterns focus on 0.618 – 0.786 of the XA move. This could push the NASDAQ down towards 4050.
NASDAQ Composite Daily Chart – Harmonic Bearish Bat Pattern
Remember to always trade with discipline. Thanks for reading.
No position in any of the mentioned securities at the time of publication. Any opinions expressed herein are solely those of the author, and do not in any way represent the views or opinions of any other person or entity.
: Worrisome to Broader Market?")

: Important Breakout Retest")