The March release of new economic projections will help clarify that.
Additionally, if incoming inflation data (we are watching the yearly change in the median CPI, shown on the previous page) runs hotter than expected it could put pressure on the Fed to strike a more hawkish tone.
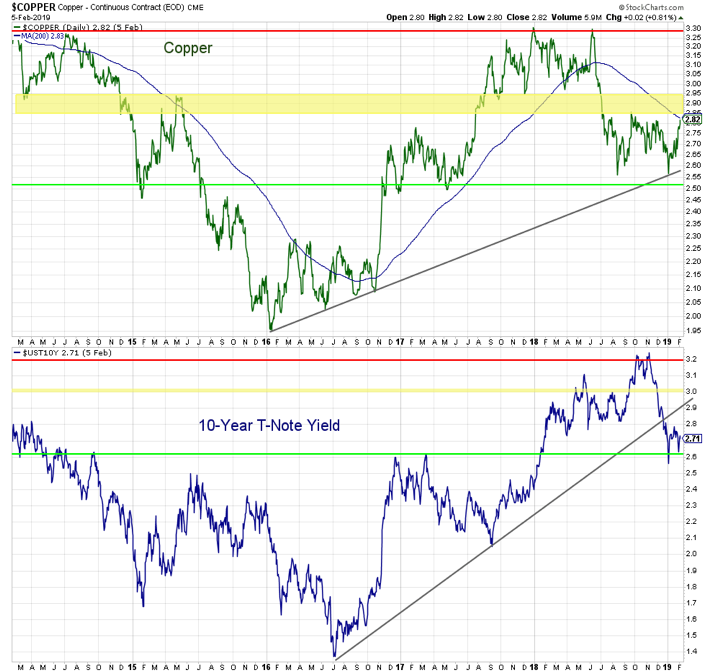
Further, a resumption in the up-trends in bond yields and/or copper prices could suggest there is more room for continued tightening than what is currently priced into the market. The futures market has a 28% chance of a rate cut by the end of 2019.
Economic Fundamentals remain bullish. While global economic risks are rising, conditions in the U.S. remain on relatively firm footing. Some slowing in growth is expected in 2019; this comes after two years of consistently accelerating growth. While global weakness is a headwind for U.S. growth, it would be quite rare for it to pull the U.S. into a recession.Given the global headwinds, some degree of patience by the Fed is likely a good thing.
A more pressing concern for the U.S. economy is evidence that business and consumer confidence is waning.The “why” behind this retrenchment (there are myriad possible explanations) is not as important as whether this is a short-lived blip or a more meaningful evaporation of the animal spirits that have supported growth in recent years.
Valuations remain bearish.We can think of valuations from two perspectives – whether what is currently priced into the market is being realized and where price and earnings are relative to their historical relationship to each other.In terms of whether current expectations are being realized, we are watching both the path of earnings expectations as well as the percentage of earnings reports that are surpassing those expectations. Earnings expectations for 2019 are being revised lower, and earnings for the first quarter are expected to be below their year-ago level. We are also seeing a dramatic drop-off in the earnings beat rate. After more than a year of 75% to 80% of reports beating expectations, the beat rate in Q4 has dropped to 72%. Stocks have tended to struggle when the beat rate is below where it was a year ago (as is now the case).
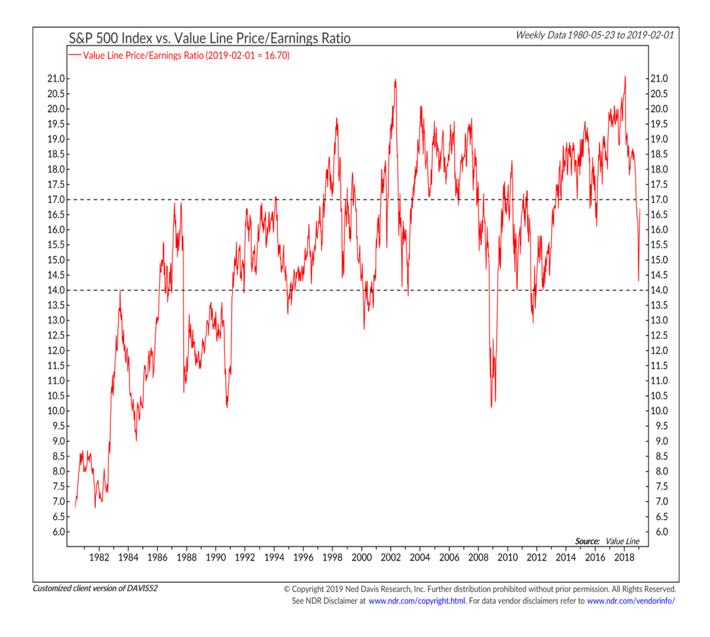
From a price-earnings perspective, 2018 provided some good news on valuation. After making an all-time high in February 2018, the Value Line P/E ratio (which blends trailing and expected numbers in its earnings component) moved sharply lower over the course of the year. It briefly approached a level that is more supportive of stock price appreciation, but the combination of a price rally and downward revisions to earnings expectations produced a sharp rebound in the P/E ratio. Taken altogether (and in light of other P/E ratios) the valuation picture is likely still a headwind for stocks.
Investor Sentiment is neutral, though the optimism that has returned as stocks have rallied is approaching elevated levels.
The good news from a sentiment perspective is that there was evidence of a meaningful panic at the December lows (investor panic is an important part of the bottoming process).
This can be seen through the lens of equity fund flows, with outflows over a four-week period approaching $100 billion. While outflows have ebbed in 2019, inflows have not been seen on an aggregate basis (in contrast to January 2018 which experienced a surge in equity fund inflows). On a more cautious note, we are seeing evidence of increased optimism in the sentiment surveys. As an example, the NAAIM Exposure index has climbed all the way back to where it was as stocks were peaking in September.
Stock Market Seasonal Patterns are neutral. At this point in the presidential cycle, seasonal patterns are typically considered a bullish tailwind for stocks. The three quarters that include the final quarter of the mid-term election year and the first half of the pre-presidential election year are the strongest in the entire cycle. Two caveats are keeping us from expecting that situation to play out in the current environment. First, the fourth quarter of 2018 posed a serious challenge to this trend. If typical seasonal strength is emerging, we would expect to see more leadership from small-caps. Second, seasonal strength in the stock market heading toward the presidential election usually gets fuel from monetary and fiscal policy stimulus.That stimulus is missing in the current environment.
Market Breadth is neutral. Coming into 2019, breadth was considered bearish. The bounce off of the Christmas Eve low was strong enough to produce a series of breadth thrusts and that helped shift breadth to neutral. Breadth thrusts have been seen on indicators based on the 10-day advance/decline ratio and the percentage of stocks trading above their 10-day averages.
The percentage of stocks trading above their 50-day averages has soared, but remains shy of the 90% threshold for signaling a breadth thrust.While breadth thrusts do not preclude re-tests, their track record in terms of signaling more favorable environments for stocks is impressive. As an example, of the 18 breadth thrusts signaled by a surge in the percentage of stocks above their 50-day averages, all 18 have been followed by higher prices a year later, with an average gain that is twice the typical experience of the S&P 500.
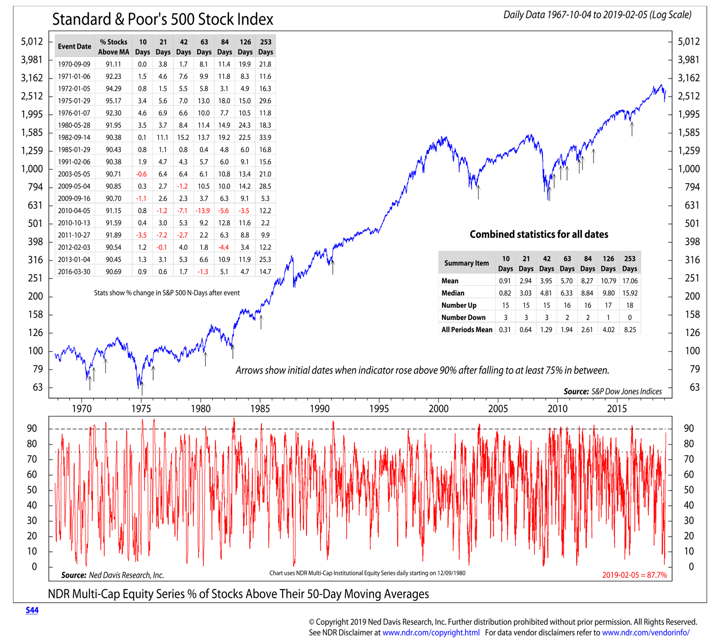
There is a risk in the current environment that the prices swings of December and January have skewed these thrust indicators. So while we have upgraded breadth from bearish to neutral, we have stopped shy of suggesting it is bullish. In large part this reflects the absence of meaningful improvement in longer-term trends.Weakness in late 2018 from a price perspective was anticipated by deterioration in the percentage of global markets with rising 200-day averages. This warned that risks were rising, so we will watch it for evidence of improvement. So far that has not been seen. We would also expect confirmation from our industry group trend indicator and an expansion in the percentage of stocks trading above their 200-day averages.
Twitter: @WillieDelwiche
Any opinions expressed herein are solely those of the author, and do not in any way represent the views or opinions of any other person or entity.

: Creating Bullish Divergence?")

: Creating Bullish Divergence?")


