The last 4 months has been a roller coaster ride for Amazon (AMZN) shareholders. During this time, the stock fell over 200 points (or nearly 30 percent) before recovering a good portion of the decline on a snap-back rally.
Back in November 2015 I spent some time showing the geometry at work with the stock chart for Amazon (AMZN). And further more, why there was great potential for a top (and strong resistance) in and around the price level where it ultimately topped in December.
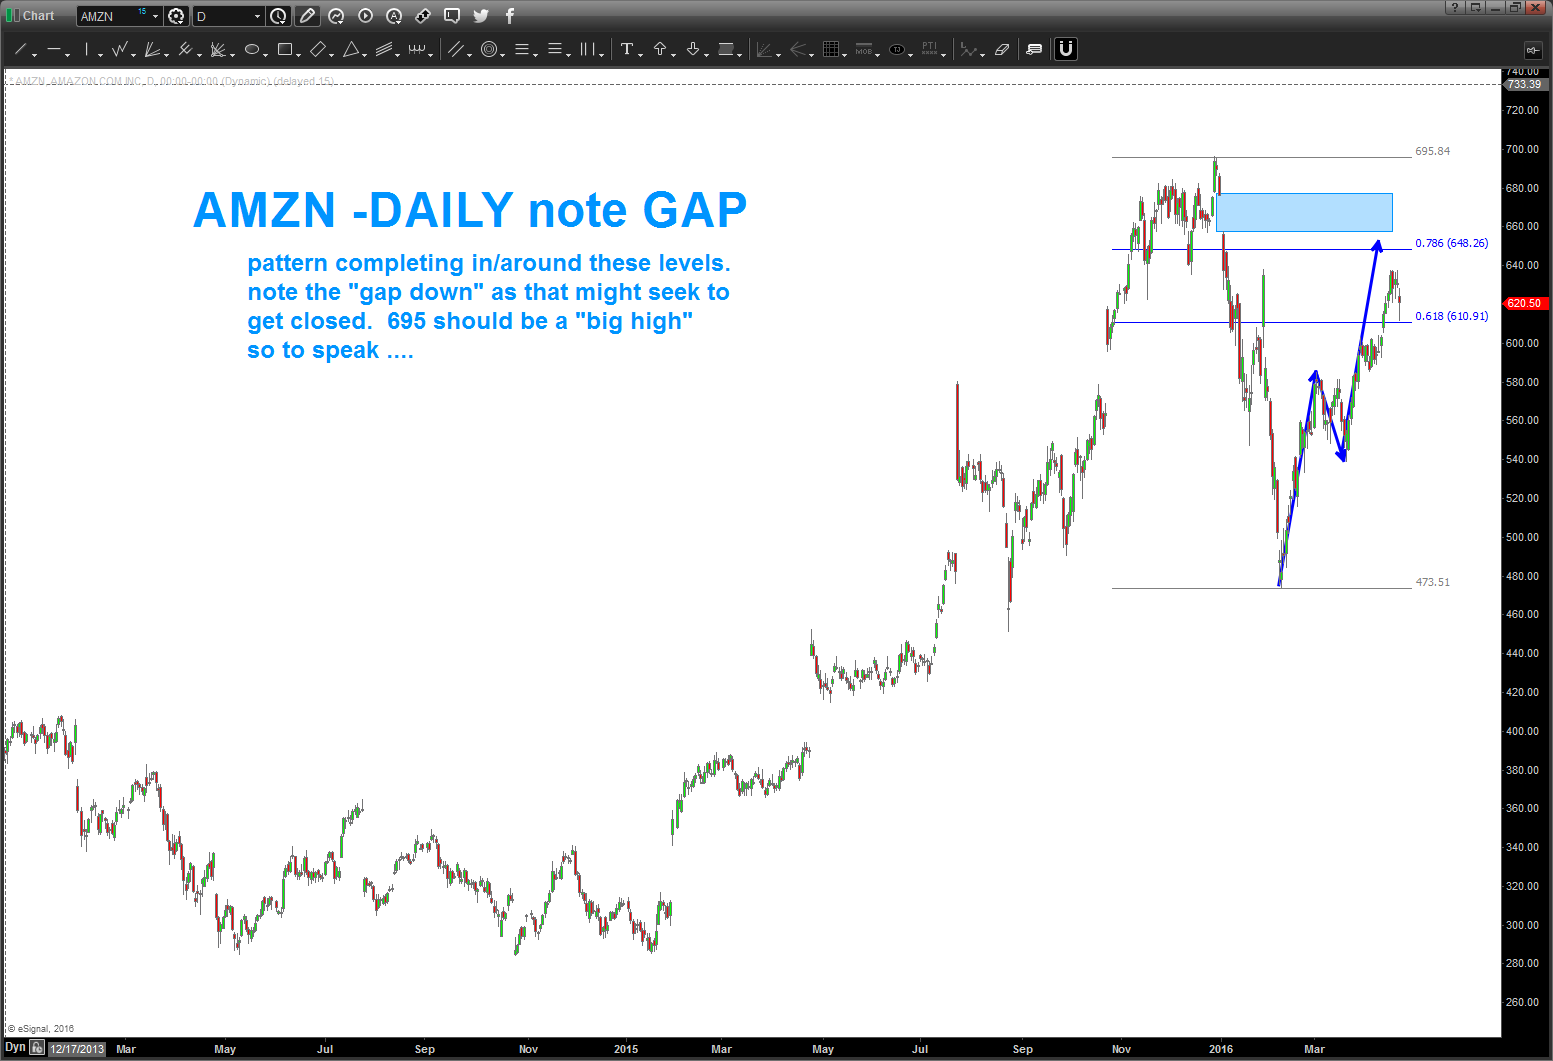
That chart pattern analysis proved to be spot on. But time has passed since, so let’s take a look at an updated Amazon stock chart and see where AMZN is at… and what to look for.
Looking at the chart below, you can see a couple of strong resistance levels overhead. Amazon (AMZN) still has the potential to reach higher price targets yet BUT the stock price would need to get past the resistance levels shown below (those higher targets were pointed out in the linked-to article above).
All this to say, I still hold a cautious outlook on AMZN.
Amazon Stock Chart – Daily
Thanks for reading and good luck out there.
More from Bart: Google Stock Update: Watching For A Top
Twitter: @BartsCharts
Author does not have a position in mentioned securities at the time of publication. Any opinions expressed herein are solely those of the author, and do not in any way represent the views or opinions of any other person or entity.

: Showing Some Signs of Emerging Strength")
