We’ve been following Alphabet stock (NASDAQ:GOOGL) for some time. It’s a very popular and well run large cap tech name. It’s leadership over the past several years has helped tech climb back to new highs.
Before I go into a current update on GOOGL’s stock price patterns, below are links to my past 3 posts on Google/Alphabet. The posts show the progression of its chart patterns:
- September 2015: Is Google Setting Up For One More Thrust Higher?
- Looking for a top in/around 818 based on the first wave being equal to the last wave (1=5)
- October 2015: Google Beats Earnings: Higher Price Targets In View
- After a monstrous earnings release the stock rocketed up towards the 820’ish area
- February 2016: Google Price Target Hit: Trading Upside Limited
- The target in that post was hit.
Let’s take a look at the charts:
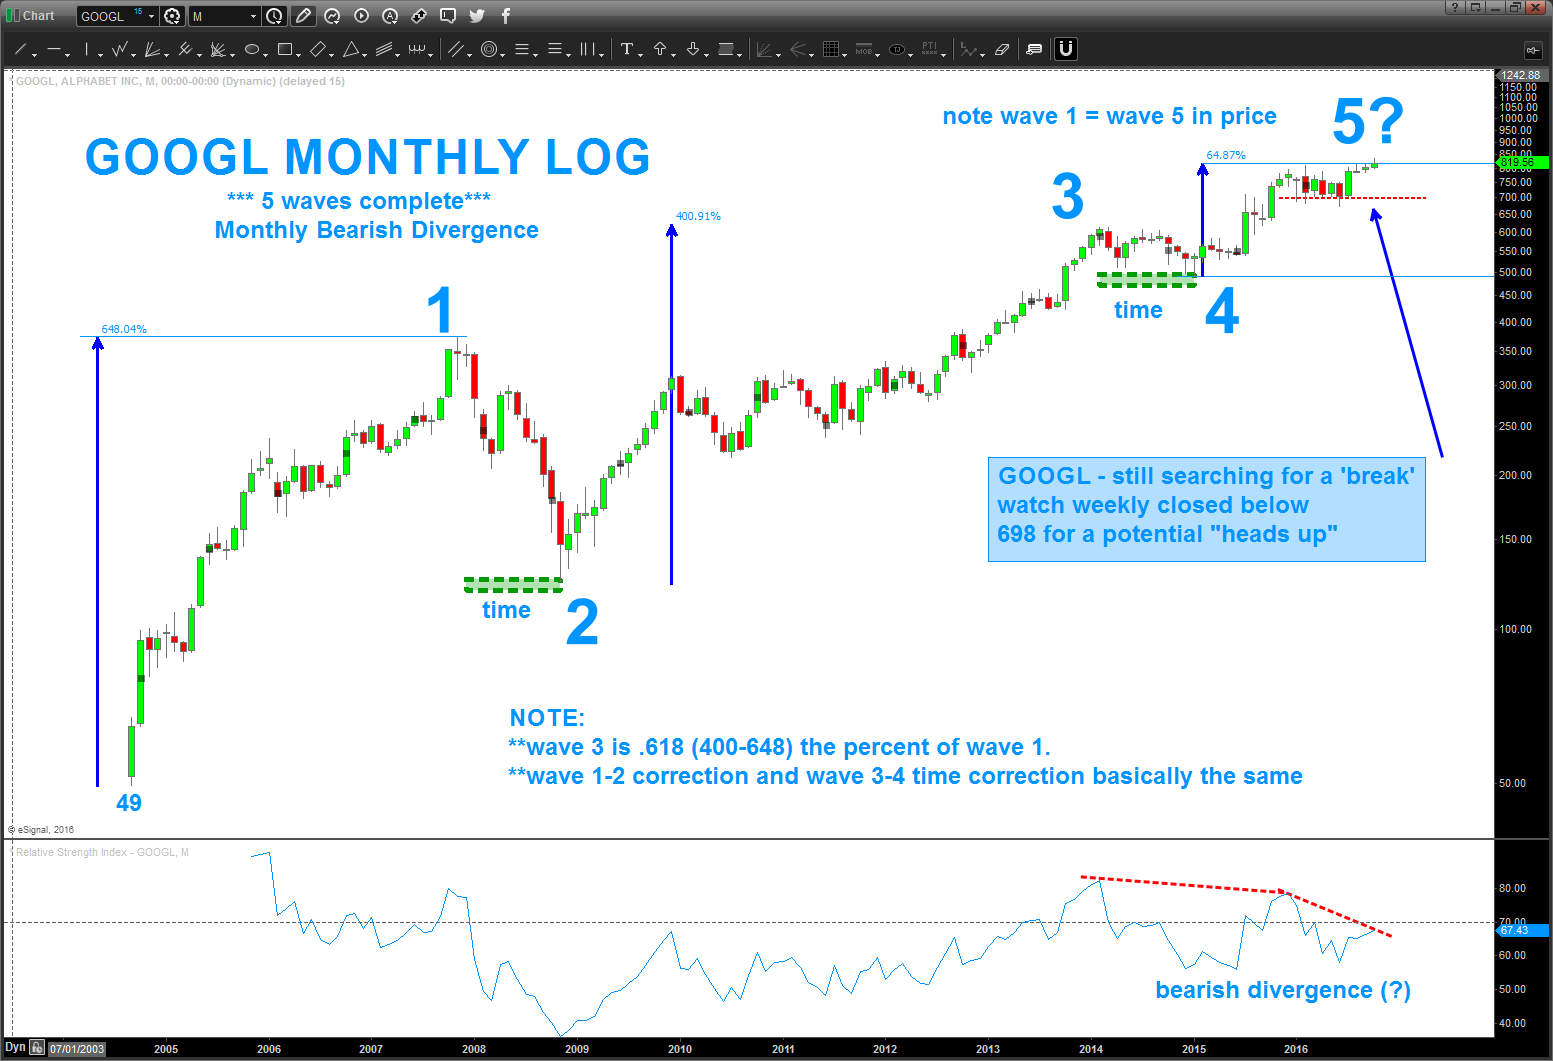
Alphabet Stock (GOOGL) MONTHLY LOG
- Shows the 5 (?) waves completing
- 3 doji’s (monthly)
- Wave 1 = Wave 3
- Wave 3 is a .618 percentage change of Wave 1 and Wave 5 (form, balance, proportion)
- Time corrections for 1-2 and 3-4 are the same (form, balance, proportion)
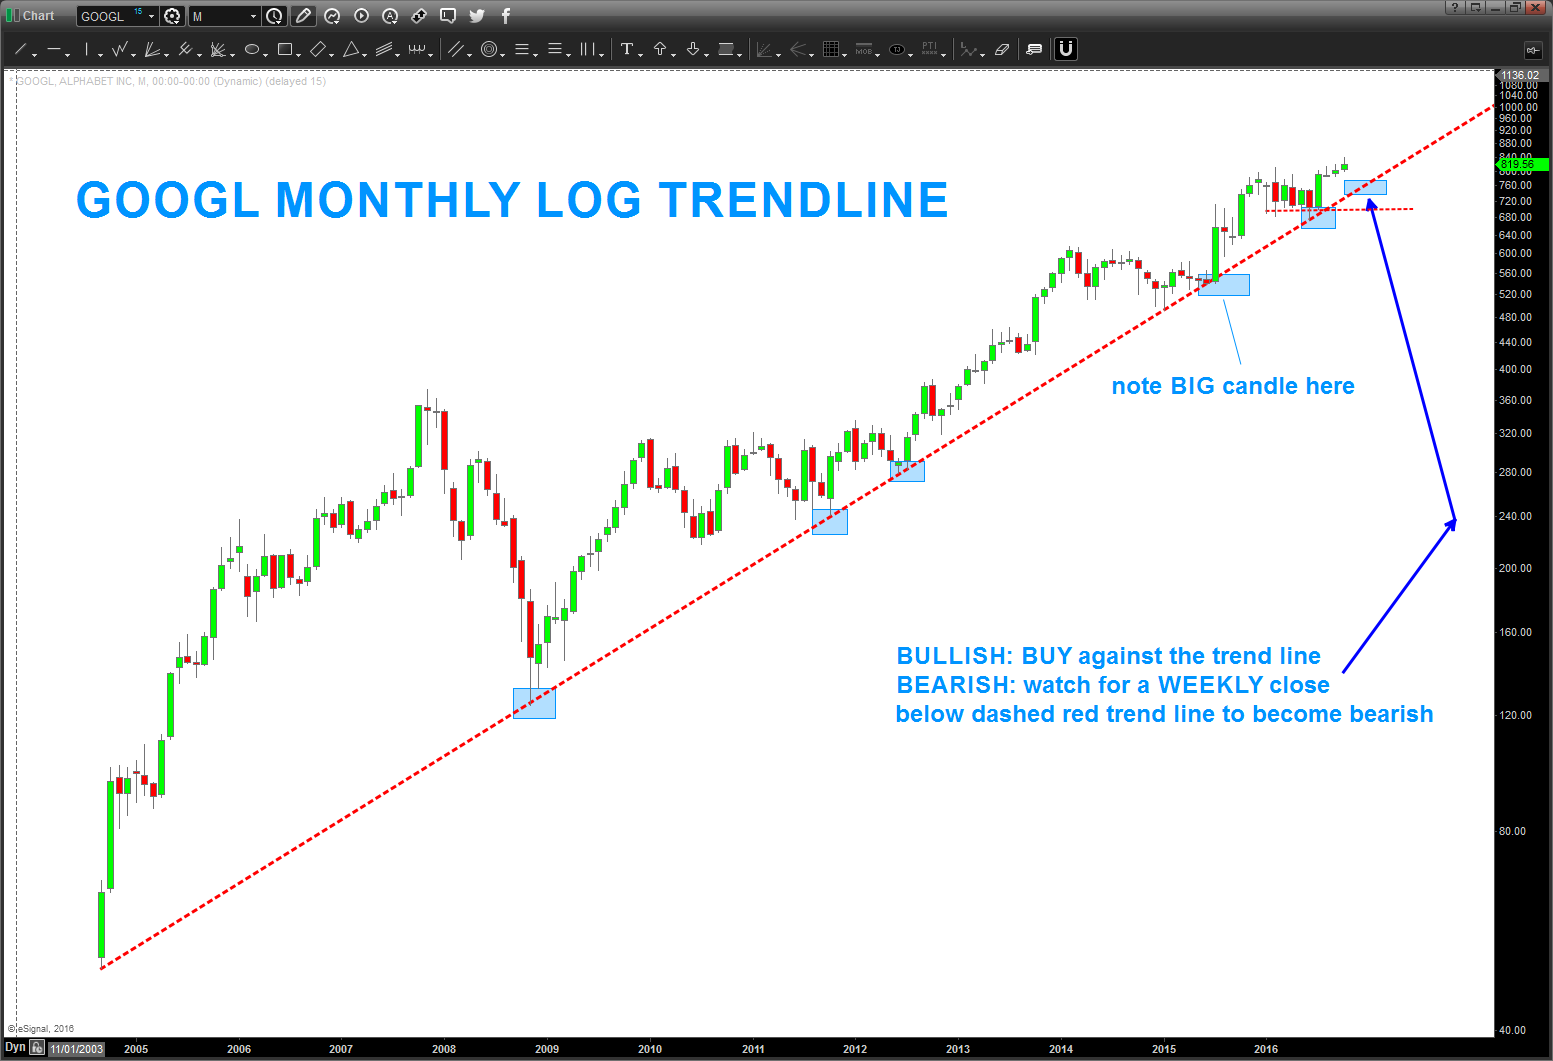
Alphabet Stock (GOOGL) MONTHLY LOG TRENDLINE
- LOG trendlines are very powerful at telling us how ‘strong’ a trend is (bearish or bullish) over a long period of time. Note, each time Alphabet’s stock price has gone down and touched the dashed red line starting from it’s IPO it has rocketed higher. EVERY TIME. So, with the analysis above as a back drop let’s play the IF / THEN game.
- IF you are bullish, THEN would wait for GOOGL to kiss this trend line to buy.
- IF you are bearish, THEN would wait for a weekly close below this trend line before taking action.
Overall, Alphabet’s stock (GOOGL) is trading at a very critical area for both PRICE and TIME.
More from Bart: Is Twitter Targeting $10/Share?
Thanks for reading.
Twitter: @BartsCharts
Author does not have a position in mentioned securities at the time of publication. Any opinions expressed herein are solely those of the author, and do not in any way represent the views or opinions of any other person or entity.


 Flirting With Critical Support… Again")