It’s been a while since I took a look at the geometry and patterns at play with Google, Inc. (GOOGL) . For me, it’s been a love-hate relationship with Google stock as some of the price patterns have FAILED BIG TIME. But, there’s another pattern in play so it’s worth another look.
The last time I posted on Google stock was this past February.
If you have some time to read it, you’ll see some quality work as Google approached it’s lows in November 2008. Then you’ll see the AB=CD pattern get smoked, the 1.27 extension level get smoked and then came the blog mentioned above (which actually worked).
I guess the 3rd time really is a charm. It corrected for a year and if I had been watching it – I wasn’t – you would have a seen a near perfect BUY pattern… and off it went.
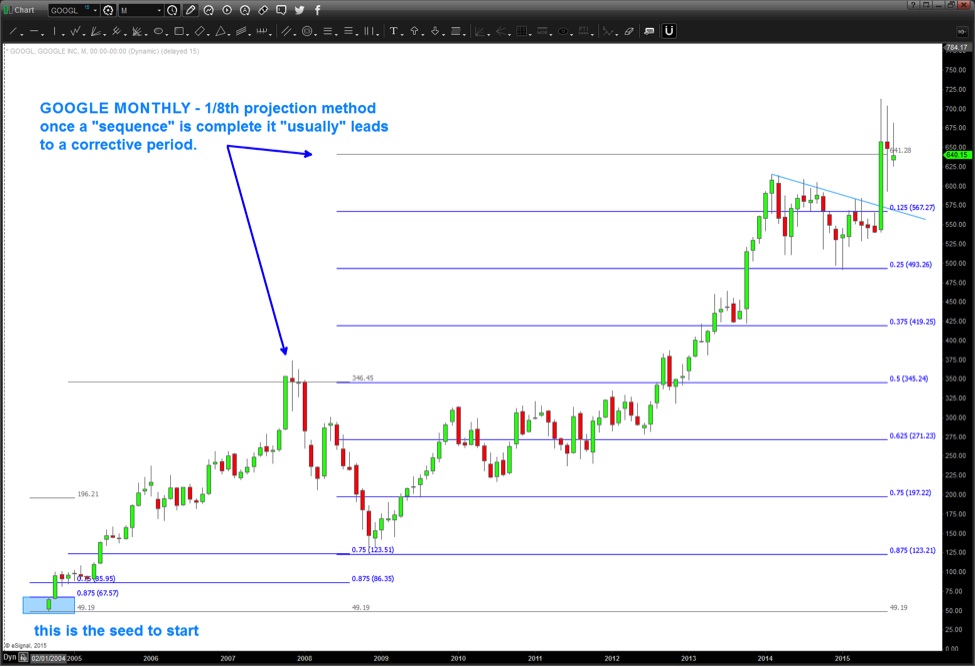
The first chart below is a simple yet very powerful 1/8 projection technique using monthly bars since the Google stock IPO… you can see we bounced right up into the 3rd iteration of this technique.
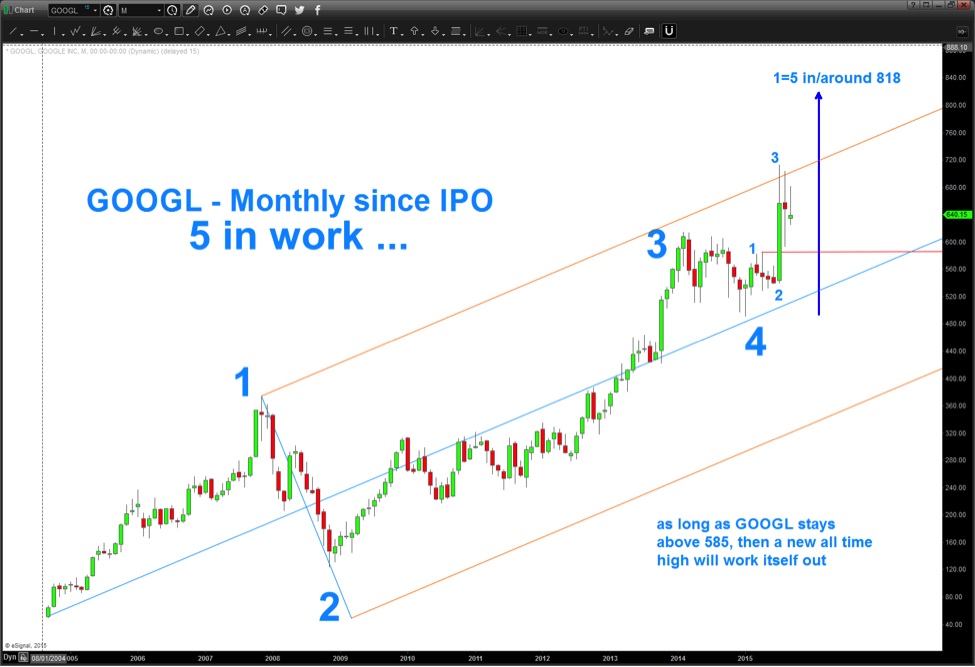
The next chart is a ‘potential’ elliott wave count showing one more new high to be made by GOOGL in the coming weeks/months. Also, note the Adams Pitchfork technique of bringing the 3rd point all the way through the price action down to the low. This is a very good way to see some very powerful trend lines. It worked like a champ in this case (and offered a nice buy entry for a trade).
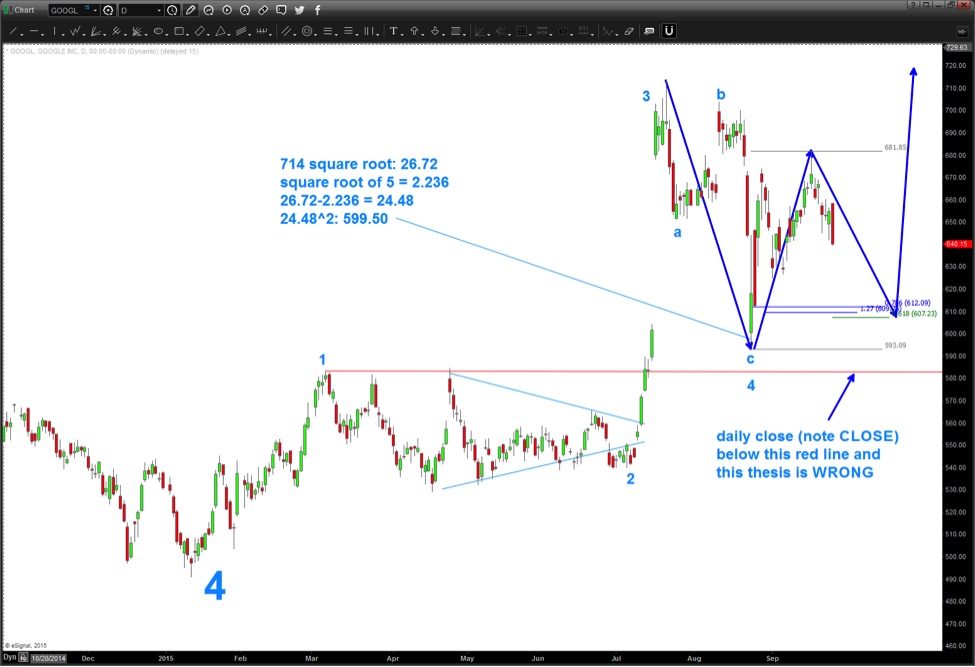
Here’s the daily Google stock chart showing the very powerful gap up filled and the “key” buy level of 607-612. It also shows how if GOOGL declines through 585 on a CLOSING basis then we’ll have to ctrl-alt-del this potential elliott wave / price pattern and take another look at it.
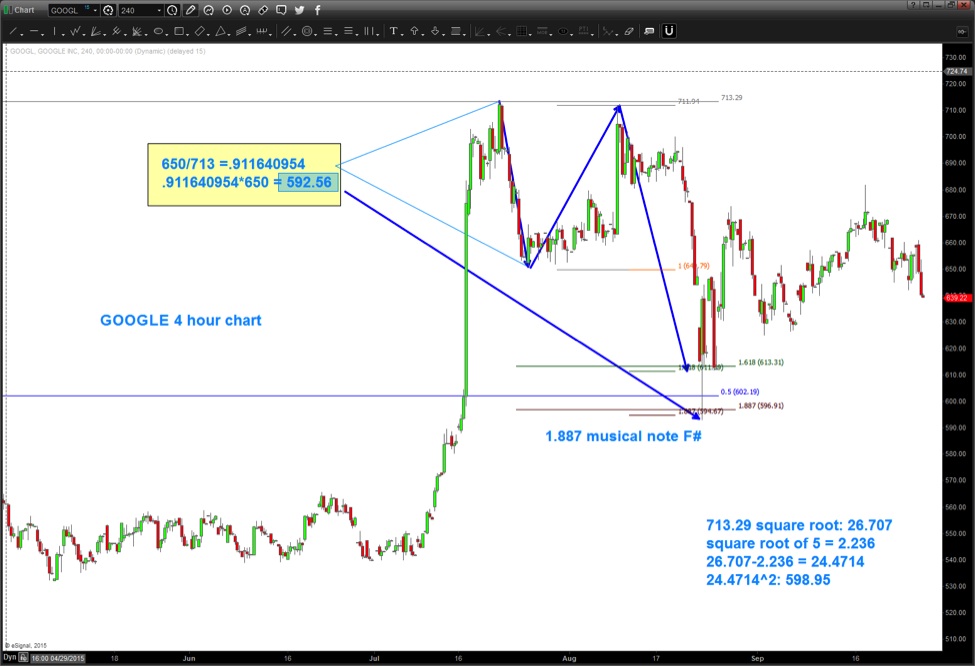
One last chart. I know this is “after the fact” but I just wanted to show you the beautiful swing set up at the most recent lows labeled ‘small 4.’ Think about it this way… IF the market is vibrational in nature, then what causes the wave? Since the market is fractal we have different impulse moves occurring on all kinds of time frames.
In this case, we dropped down to a 4 hour chart and calculated the initial impulse wave shown in the yellow box below. The initial impulse wave is the cause of the move and knowing that we can calculate a fundamental frequency. Knowing where these levels are – is very helpful. In this case, it calculated the most recent low for Google stock price. Cheers and best of luck out there.
Thanks for reading.
Twitter: @BartsCharts
Author does not have a position in mentioned securities at the time of publication. Any opinions expressed herein are solely those of the author, and do not in any way represent the views or opinions of any other person or entity.

: Cup (and Maybe Handle) Watch")
 Trading Near Top Of Price Range")

