We have been highlighting several market indicators trading at critical time/price areas over the past month or so.
And today is no different as we take a look at the Advance/Decline Line for NYSE common stocks. This is a very important measure of market breadth looking at the number of advancing versus declining stocks each day.
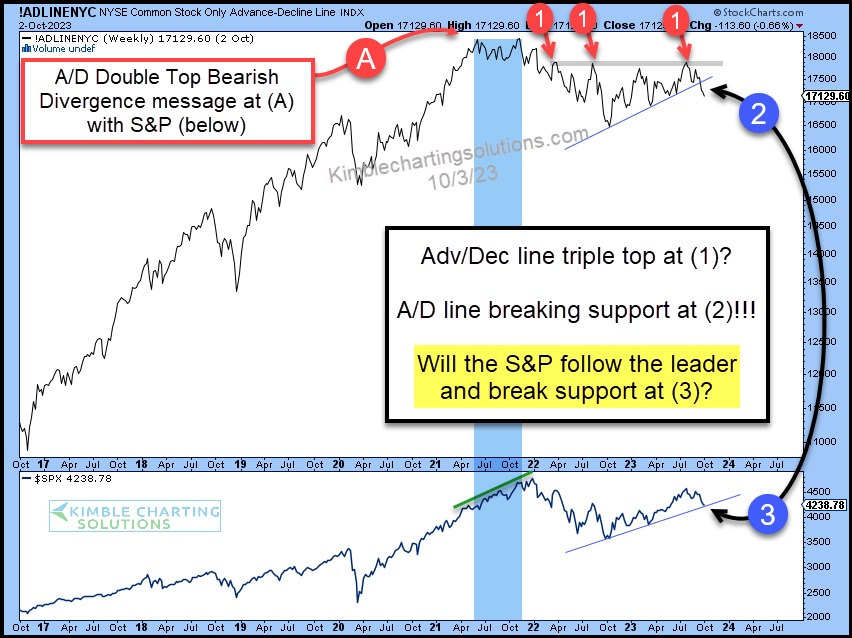
As you can see in the chart below, the Advance/Decline Line (A/D Line) created a double top (blue shade) before creating a triple top at (1). And now it is breaking down below support at (2). Yikes!
Looking at the lower pane in the chart, I humbly ask, “will the S&P 500 follow the leading indicator and break support at (3)???
Could the A/D Line be sending a new message to the markets with its breakdown at (2)? Stay tuned!
Advance/Decline Line Chart
Note that KimbleCharting is offering a 2 week Free trial to See It Market readers. Just send me an email to services@kimblechartingsolutions.com for details to get set up.
Twitter: @KimbleCharting
Any opinions expressed herein are solely those of the author, and do not in any way represent the views or opinions of any other person or entity.


: Showing Some Signs of Emerging Strength")
